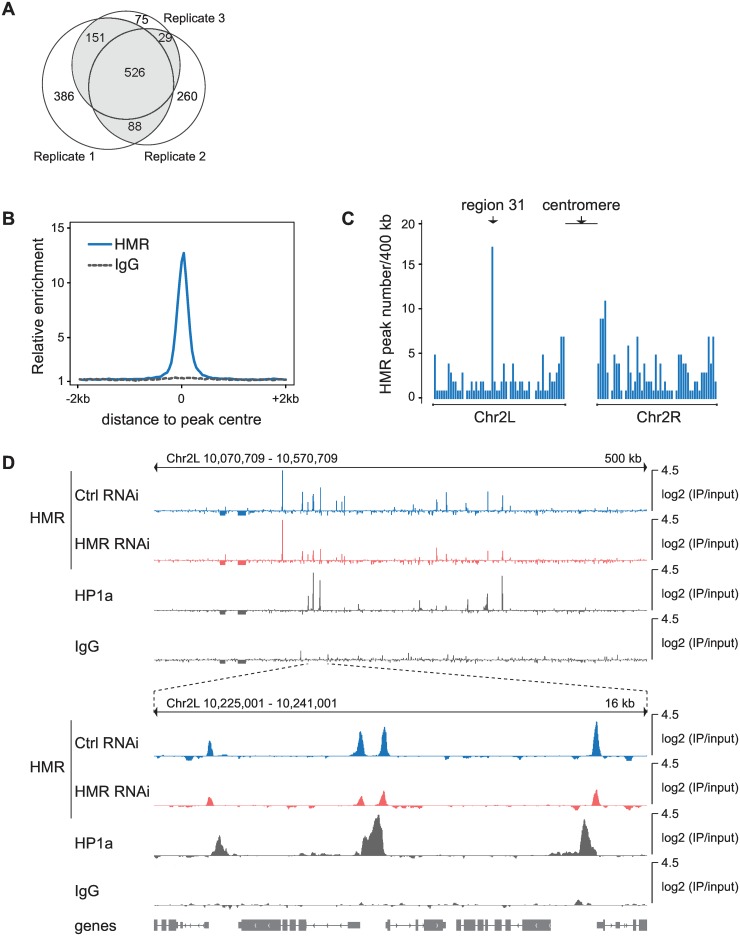
Fig 1. Identification of HMR binding sites in D. melanogaster S2 cells.
(A) Venn diagram of HMR peaks showing the number of peaks identified in three independent biological replicates. Peaks identified in at least two out of three replicates were used for further analysis and are highlighted in grey. (B) Composite analysis of HMR and control IgG (anti-FLAG) ChIP signals at genomic HMR peak positions. (C) Histogram of HMR peak density across the left arm (2L) and right arm (2R) of the 2nd chromosome. The cytological region 31 and centromere-proximal regions are indicated (D) Genome browser view of HMR, HP1a and control IgG (anti-FLAG) ChIP signals at region 31. HMR ChIP signals obtained upon knock-down using control RNAi and HMR RNAi are shown with the same amplitude.

