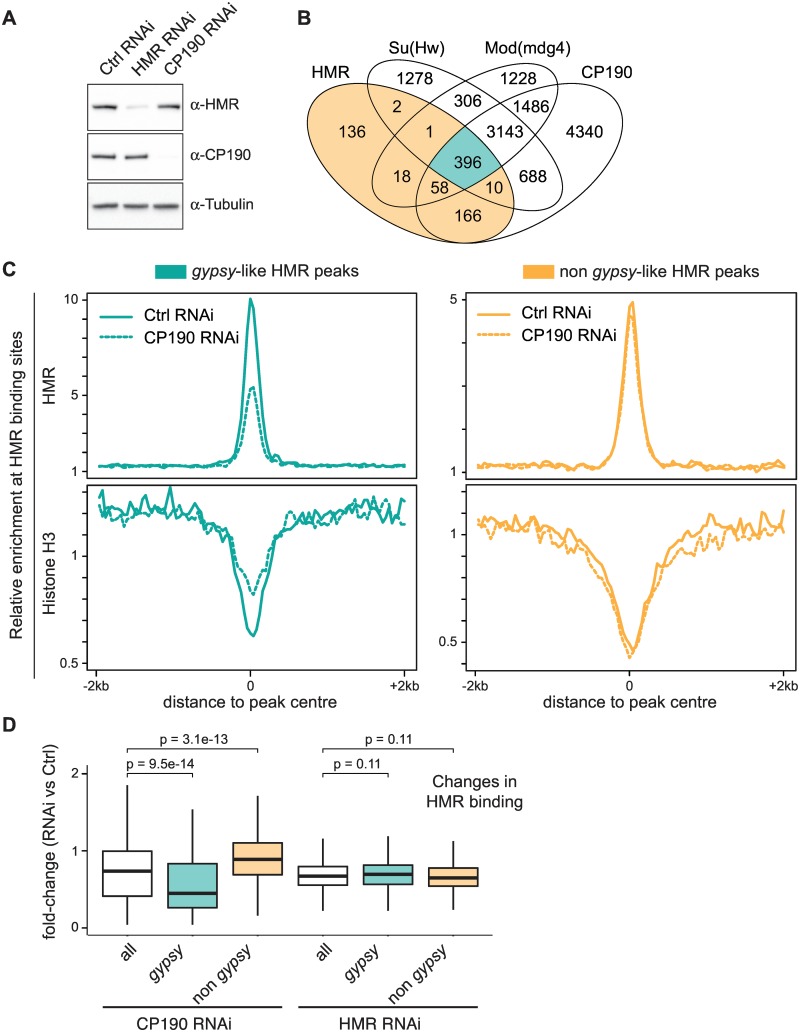
Fig 4. HMR genomic localization to gypsy-like insulator sites is dependent on CP190.
(A) Western Blot of cell lysates after treatment with specific and control dsRNA shows an efficient knock-down of HMR and CP190. (B) Venn diagram of the overlap between HMR, CP190, Mod(mdg4) and Su(Hw) peaks [39] classifying HMR peaks as gypsy-like (highlighted in green) and non gypsy-like (highlighted in orange). (C) Composite analysis of HMR ChIP signals and Histone H3 ChIP signals at genomic HMR peak positions according to the groups defined in (B). (D) Quantification of the fold-change of HMR ChIP enrichment upon CP190 RNAi and HMR RNAi. Box plots represent the fold-change of normalized HMR ChIP tag number aligned to 200 bp wide HMR peak regions. Peak regions with less than 50 aligned tags were excluded from the analysis. Significance of difference was estimated with p-values calculated with Wilcoxon rank sum test [72].

