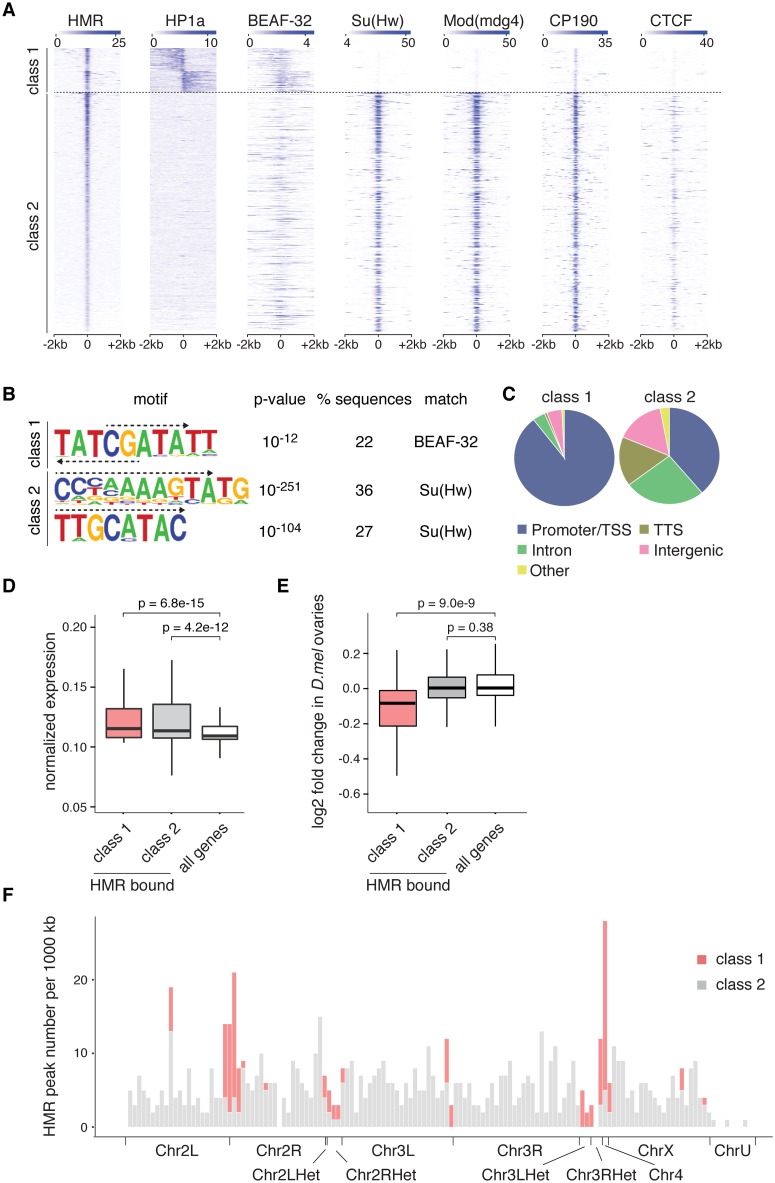
Fig 5. HMR borders HP1a together with BEAF-32 at the TSS of actively transcribed genes and enhances their transcription.
(A) Heatmaps of HMR, HP1a, BEAF-32 [40], Su(Hw), Mod(mdg4), CP190 and CTCF [39] ChIP signals. All signals are centered around the HMR binding sites, clustered according to adjacent HP1a signals and sorted by HMR intensity. (B) Sequence motifs identified within HMR peak regions from class 1 and class 2 based on HOMER motif analysis. The corresponding motif logo, p-value of enrichment, percentage of regions with this motif, and putative binding factors are indicated. Dashed arrows mark the sequence that matches the published binding sites of Su(Hw) and BEAF-32 (see also S2A Fig). (C) Distribution of class 1 and class 2 HMR peaks among various genomic landmarks. (D) Box plot showing the normalized RNA expression of all genes and HMR-bound genes (promoter/TSS annotated) in class 1 and in class 2. S2 cells RNA expression levels were used according to [73]. Significance of difference was estimated with p-values calculated with Wilcoxon signed rank test [72]. (E) Box plot showing the log2 fold change of protein coding gene transcripts of all analyzed genes and HMR-bound genes (promoter/TSS annotated) in class 1 and in class 2 comparing Hmr mutant against wild type flies. The RNA-Seq data comes from experiments done in D. melanogaster ovaries [4]. Significance of difference was estimated with p-values calculated with Wilcoxon rank sum test [72]. For both box plots the box represents the interval that contains the central 50% of the data with the line indicating the median. The length of the whiskers is 1.5 times the interquartile distance (IQD). (F) Histogram showing HMR peak density across the annotated D. melanogaster genome. Class 1 HMR binding sites are enriched at region 31, centromere-proximal regions and the 4th chromosome.

