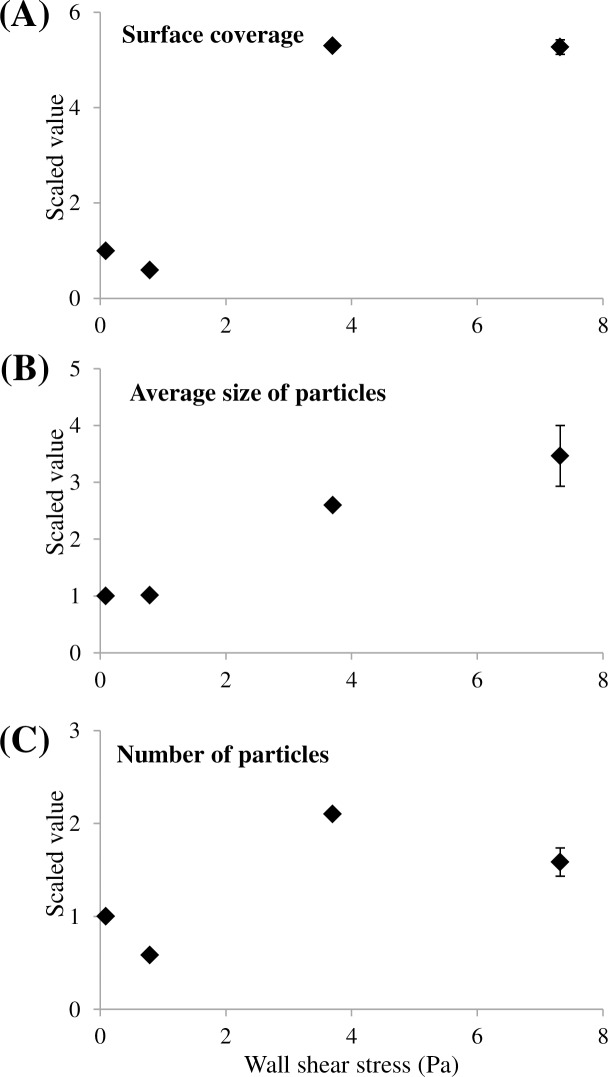
Fig 2. Results of the morphological characterization for Phase 2, shear stress impact test.
Three morphological parameters–surface coverage (A), number of particles (B), average size of particles (C)–are reported for the different wall shear stresses tested (Shear 1 and Shear 2 experiments). Data result from microscopic observations and image analysis of acquired pictures. As mentioned in Table 2, two and three slides of PP were characterized per reactor for Shear 1 and Shear 2, respectively. In order to compare on the same graph the four wall shear stresses tested, original values were scaled by the value obtained at 0.09 Pa shear. The y-axis represents this ratio, hence it is dimensionless.

