
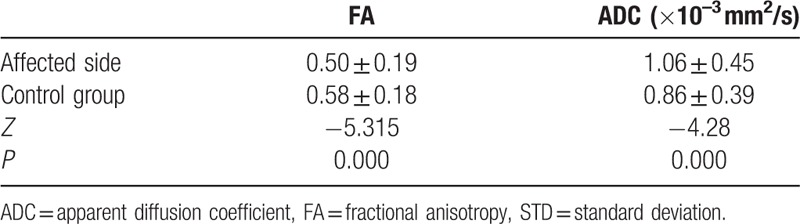
Table 3.
Comparison of FA and ADC values of V3 branch of the trigeminal nerve between the affected side of patient group and control group (n = 52 and 30, mean ± STD).
Official websites use .gov
A
.gov website belongs to an official
government organization in the United States.
Secure .gov websites use HTTPS
A lock (
) or https:// means you've safely
connected to the .gov website. Share sensitive
information only on official, secure websites.
Comparison of FA and ADC values of V3 branch of the trigeminal nerve between the affected side of patient group and control group (n = 52 and 30, mean ± STD).