Figure 1.

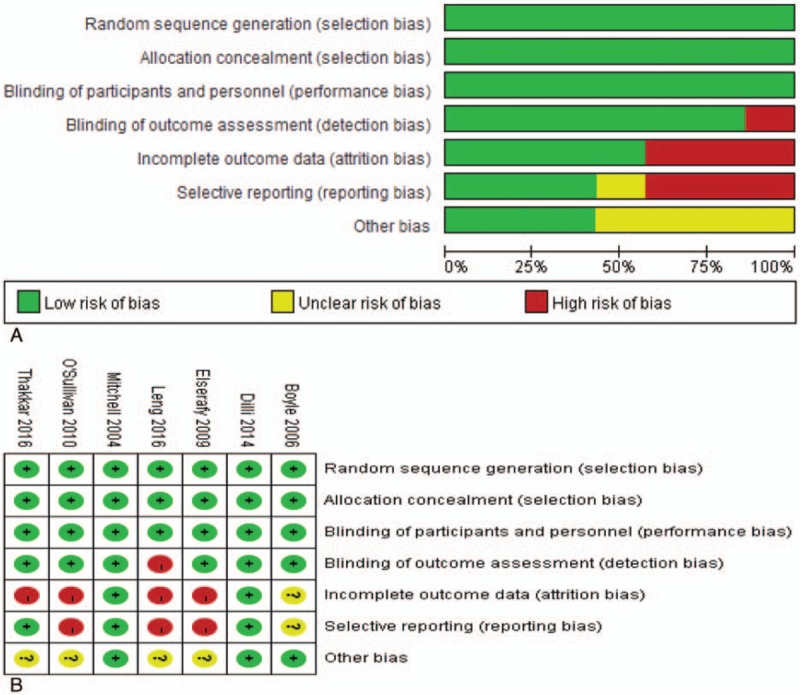
Assessment of risk of bias: (A) risk of bias graph and (B) risk of bias summary. Quality of each study was evaluated from 7 aspects and was classified as “low risk” (green), “high risk” (red), or “unclear risk” (yellow).

Assessment of risk of bias: (A) risk of bias graph and (B) risk of bias summary. Quality of each study was evaluated from 7 aspects and was classified as “low risk” (green), “high risk” (red), or “unclear risk” (yellow).