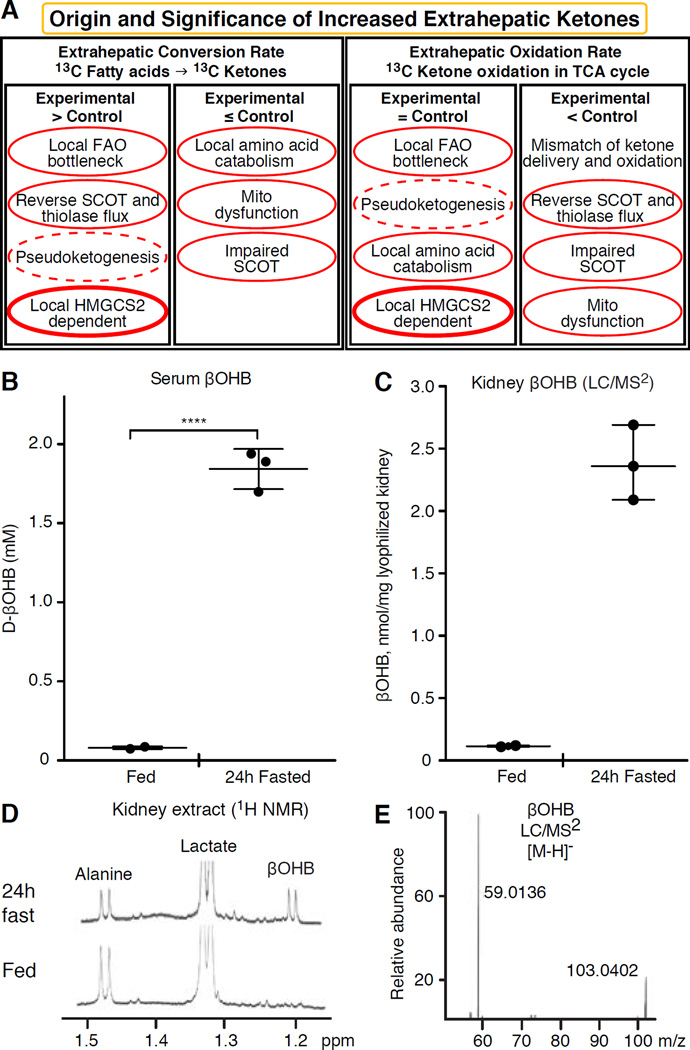
Fig. 2. Evaluation of extrahepatic ketone body concentrations.
(A) Increased steady state abundance of ketone bodies in one biological condition versus another may indicate local ketogenesis, but other interpretations are possible, including selective impairment of ketone oxidation, or global impairment of mitochondrial oxidative function. Experiments that employ isotopically labeled ketone bodies and fatty acids, specifically tracking the fate of the labeled intermediates, are often reliable approaches to demonstrate ketogenesis. Pseudoketogenesis is isotopic dilution without true ketone production, dashed elliptical line. SCOT function can be selectively inhibited by diminished expression or PTM. The SCOT and thiolase reactions are reversible, and can thus support either true ketogenesis or pseudoketogenesis. Only HMGCS2 dependent ketogenesis can support millimolar ketone accumulation (thick elliptical line). Results not clearly circumscribed by this analysis likely indicate that a difference in tissue ketone concentration is attributable to variations of hepatic ketogenesis. (B–E) Extrahepatic tissue ketone concentrations do not exceed that in the circulation. Ten week-old female C57BL/6 mice were bled, and kidneys were harvested in the random fed and 24h fasted states. All measurements (n=3/group) were performed in blinded manner. (B) βOHB concentrations were quantified in serum using standard biochemical enzymatic reagents coupled to a spectrophotometrically-coupled substrate (Wako). βOHB concentrations were also quantified in kidney from fed or 24h fasted mice by (C) LC/MS2 or (D) 1H NMR. For LC/MS2, two milligrams of lyophilized and homogenized kidney powder were extracted using optimized protocol in cold (−20°C) 2:2:1 methanol: acetonitrile: water containing sodium β-[U-13C]hydroxybutyrate as an internal standard. Quantitation was performed on Dionex 3000 RS liquid chromatography stack coupled to a Thermo Q Exactive Plus mass spectrometer. Separation was optimized on a Phenomenex Luna NH2 column in hydrophilic interaction liquid chromatography mode. Spectrometer was operated in negative Parallel Reaction Mode and MS resolution was set to 17,500. βOHB and its internal standard were quantified using expected m/z transitions of (E) 103.0401 → 59.0133 and 107.0535 → 61.0200 (internal standard’s transition not shown), respectively, with less than 10 ppm mass accuracy. NMR spectra were collected at 25°C in D2O from perchloric acid extracts of a single snap frozen kidney harvested from fed (bottom) and 24h fasted (top) mice. Data were collected under quantitative steady state conditions using a cryoprobe at 14.1T (Bruker) using trimethylsilylpropionate as an internal chemical shift and concentration reference. Chemical shifts corresponding to renal alanine, lactate, and βOHB are shown. Calculated mean renal βOHB concentrations were 0.08 nmol/mg wet tissue in the fed state, and 0.93 nmol/mg wet tissue in the 24h fasted state. Note that higher apparent βOHB concentrations were quantified via LC/MS2, compared to those derived from NMR-based measurements, due to the use of dry versus wet kidney tissue, respectively.

