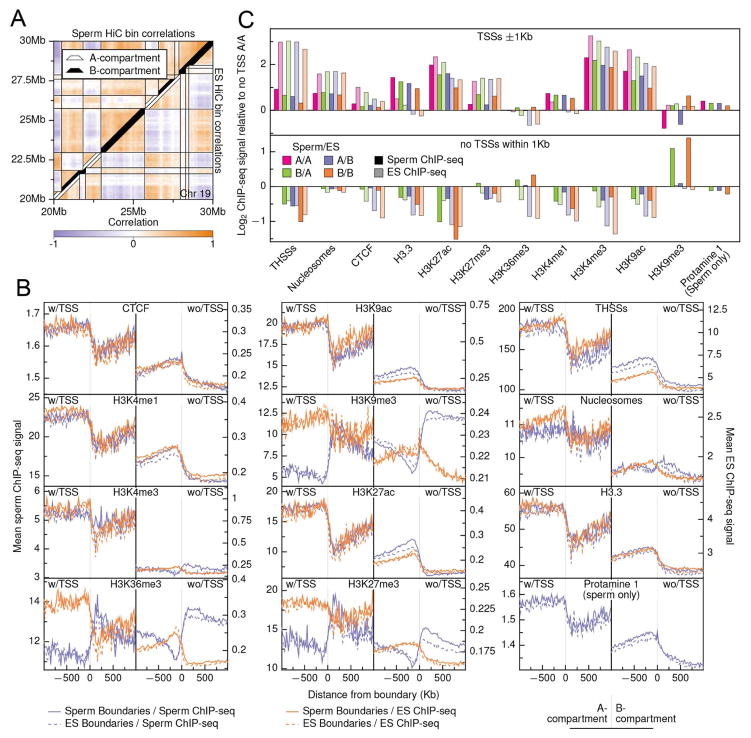
Figure 6. Comparison of genes, histone modifications and proteins across sperm and mESC chromatin compartments.
(A) Chromatin compartment calls for sperm and ES cells overlaid on a heatmap of 10 kb bin pairwise correlations.
(B) Average ChIP-seq signal centered on compartment boundaries +/− 1 Mb. Signals were binned in 20 kb bins and were truncated to at the 95th percentile of signal prior to finding means to remove outliers. All signals were oriented to go from an A-compartment (left) to a B-compartment (right) prior to finding the mean signal. Left-side plots show mean signal for bins containing at least one TSS while right-side plots show mean signal for all non-TSS containing bins.
(C) Log-enrichments of mean ChIP-seq signals for each compartment class compared to the A/A TSS-free signal for each factor. Mean signals were found across all bases within a class that fell within one kb of a TSS within that class (top) and for all other bases in each class (bottom).
See also Figures S5

