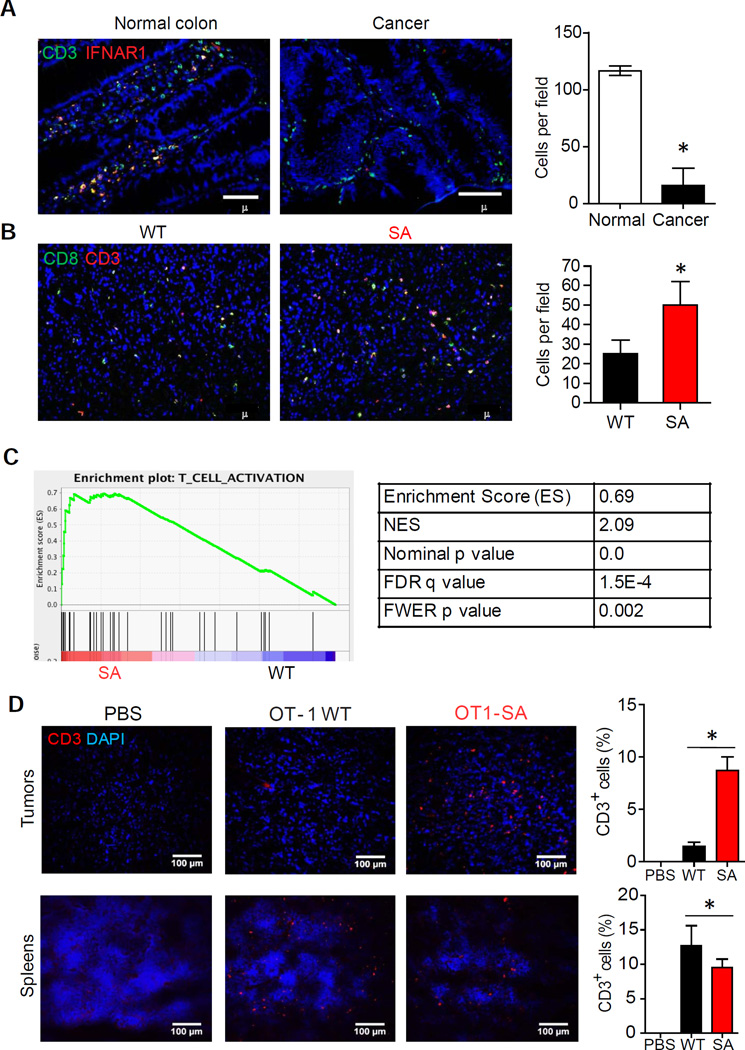
Figure 5. Downregulation of IFNAR1 in cytotoxic T lymphocytes contributes to development of the immunosuppressive tumor microenvironment in CRC.
(A) Representative immunofluorescent analysis and quantification of IFNAR1hiCD3+ T cells infiltration of human normal colon and CRC. Tissue sections were stained with antibodies against IFNAR1 (red) and CD3 (green) and contrasted with DAPI (blue). At least 20 randomly chosen fields from each of 8 patient samples for each group were quantified.
(B) Representative immunofluorescent analysis and quantification of CD3+CD8+ T cells infiltration of MC38 tumors from WT and SA mice. Tumor sections were stained with anti CD3 (red) and CD8 (green) antibodies and contrasted with DAPI (blue). At least 20 randomly chosen fields from each of 5 tumor samples were quantified.
(C) GSEA results of the T-cell activation gene signature in WT and SA tumors.
(D) Representative immunofluorescent analysis of T cells found in spleens or MC38OVA tumors grown in Rag1−/− mice after treating these mice with PBS or adoptive transfer of WT or SA OT-1 T cells (2×10⁷ per mouse). Data depicted as % of CD3+ cells among all DAPI-stained cells and are representative of at least 20 random fields scored from tissues of 4 mice.
Data are shown as Mean+SEM.
See also Figure S5.

