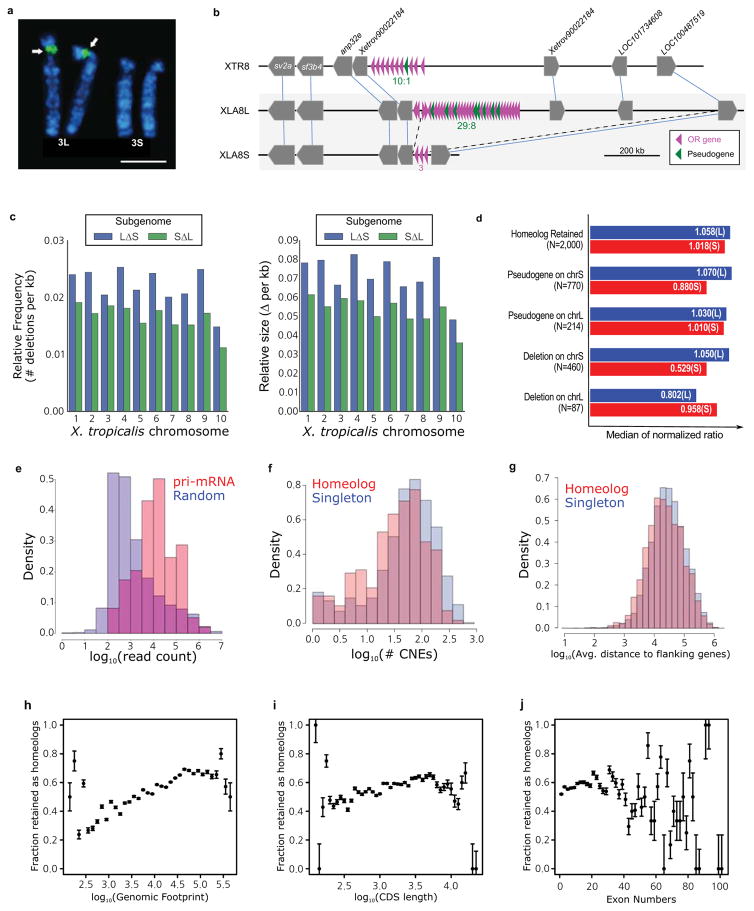
Chromosomal locations of the 45S pre-ribosomal RNA gene (rna45s), which encodes a precursor RNA for 18S, 5.8S, and 28S rRNAs, was determined using pHr21Ab (5.8-kb for the 5′ portion) and pHr14E3 (7.3-kb for the 3′ portion) fragments as FISH probes. DNA fragments used for the probes were provided by National Institutes of Biomedical Innovation, Health and Nutrition, Osaka, and labeled with biotin-16-dUTP (Roche Diagnostics) by nick translation. After hybridization, the slides were incubated with FITC-avidin (Vector Laboratories). Hybridization signals (arrows) were detected to the short arm of XLA3L, but not XLA3S. Scale bar represents 5 μm.
A large deletion including an olfactory receptor gene (or) cluster. Schematic structures of or gene clusters and adjacent genes on the 8th chromosomes of X. tropicalis (XTR8) and X. laevis (XLA8L and XLA8S). Chromosomal locations: XTR8:107,524,547-108,927,581; XLA8L:105,062,063–106,610,199; XLA8S:91,630,596–92,060,451. Horizontal bars, genomic DNA sequences; triangles, genes. Outside of or gene cluster, only representative genes are shown. The length of triangle is to scale. The orientation of triangles indicates 5′ to 3′ direction of genes. Thin lines connect orthologous/homeologous genes. Magenta triangles, or genes; green triangles, pseudogenes (point-mutated or truncated or genes). The number of or genes is shown underneath gene clusters. Dotted lines, a deleted region in XLA8S in comparison with XLA8L. The centromere is located on the left side and the telomere is on the right.
The relative frequency (left panel) and size (right panel) of genomic regions deleted in the S (blue) and L (green) chromosomes respectively. Both subgenomes experienced sequence loss through deletions, however, the deletions on the S subgenome are larger and have been more frequent. Deletions were called based on the progressive Cactus sequence alignment between the X.laevis L and S subgenomes and the X. tropicalis genome. Chromosome 9_10 of laevis was split into 9 and 10 on basis of alignment with the X. tropicalis chromosomes. Sequences from L that were not present on S, but could at least partially be identified in X. tropicalis, and consisted of gaps for no more than 25% of their length were called as deleted regions in S. The same procedure was followed for deleted regions in L.
Identification of triplet loci is described in
Supplemental Note 8.1. Loci were classified into groups based on the presence of gene 2 in both
X. laevis subgenomes (homeolog retained), versus those that had a pseudogene in the middle (pseudogene) or no remnant of the middle gene as assessed by Exonerate (deletion). To normalize the intergenic lengths we divided the nucleotide distance between genes 1 and 3 in either
X. laevis subgenome by the orthologous distance in
X. tropicalis. The median of the normalized ratio distribution is plotted on the bar chart. On average S deletions appear to be larger than L deletions (52.9% length vs 80.2% the size of the orthologous
X. tropicalis region respectively).
The number of RNA-seq reads aligning +/− 1kb of precursor miRNA loci (red) was compared to the read count for 10,000 random unannotated 2.1 kb regions of the genome (blue). All 83 homeologous, intergenic miRNA pairs showed alignment within their regions, as opposed to 4,127/10,000 (41.27%) of the randomly chosen intergenic sequences. The putative primary-miRNA loci have a higher read count than the expressed randomly chosen regions as well (Wilcoxon p=1.4E-38).
The CACTUS alignment was parsed to identify flanking CNE around each X. tropicalis gene. The number of CNEs > 50bp in length for singletons is shown in red, homeologs in blue. Komologrov-Smirnov test p-value is 1E-11.
The average distance to the nearest gene was computed for each chromosomal locus in X. tropicalis. The average intergenic distance for those with a single X. laevis gene is shown in red, those with two shown in blue. Wilcoxon p-value= 9.8E-24.
The distribution of gene retention by genomic footprint of the X. tropicalis ortholog. We define genomic footprint as the genomic distance from the start signal of the CDS to the stop signal, including introns. The x axis shows log10(genomic footprint), the y-axis is the retention rate of each bin. The error bars are the standard deviation of the total divided by the number of genes in each bin. We tested for significant differences in length between homeologs and singletons by a Wilcoxon test (p-value = 2.4E-96).
The distribution of gene retention by CDS length of the X. tropicalis ortholog. The x axis shows log10(CDS length), the y-axis is the retention rate of each bin. The error bars are the standard deviation of the total divided by the number of genes in each bin. We tested for significant differences in length between homeologs and singletons by a Wilcoxon test (p-value= 1.7E-21).
The distribution of gene retention by exon number of the X. tropicalis ortholog. The x axis shows number of exons; the y-axis is the retention rate of each bin. The error bars are the standard deviation of the total divided by the number of genes in each bin. We tested for significant differences in length between homeologs and singletons by a Wilcoxon test (p-value= 3.2E-8).

