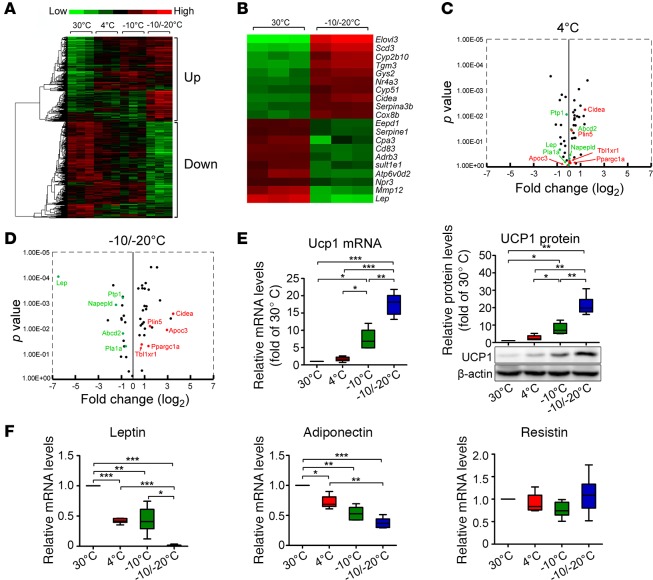
Figure 2. Genome-wide profiling, qPCR, and Western blot analyses of eWAT.
(A–D) Genome-wide profiling of eWAT with exposure to various temperatures by heat map and volcano analyses (n = 3 samples per group). (E) Left panel: qPCR analysis of Ucp1 expression in eWAT with exposure to various temperatures (n = 6 samples per group). Right panel: qPCR and Western blot analyses of UCP1 protein expression in eWAT (n = 6 samples per group). (F) Quantification of Leptin, Adiponectin, and Resistin mRNA levels in s.c. WAT exposed to various temperatures (n = 6 samples per group). *P < 0.05; **P < 0.01; ***P < 0.001, one-way ANOVA. Box-and-whisker plots show median (line within box), upper and lower quartile (bounds of box), and minimum and maximum values (bars).

