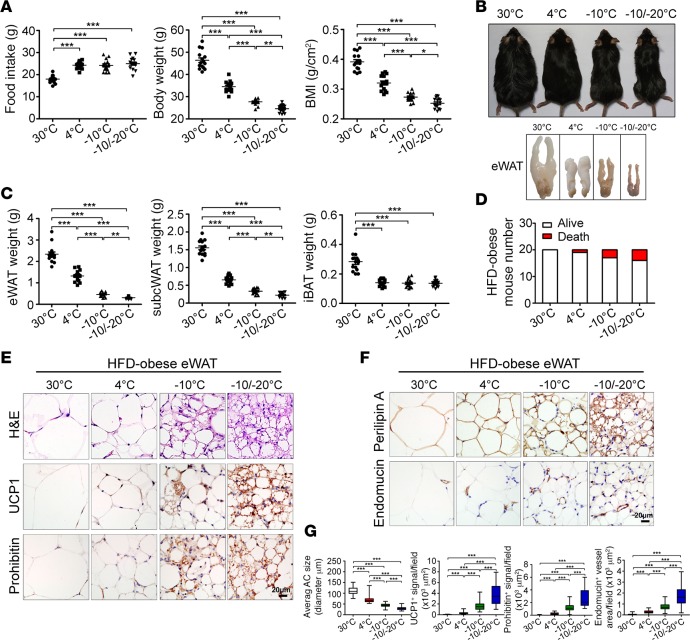
Figure 3. Food intake, body weight, BMI, and browning of visceral WAT of HFD-fed obese mice.
(A) Food intake per week, body weight, and BMI of various temperature-exposed HFD-fed obese mice (n = 15 mice per group, data represent mean ± SEM, one-way ANOVA). (B) Mouse morphology and eWAT morphology. (C) Fat mass of eWAT, s.c. WAT, and iBAT of various HFD-fed obese mice (n = 15 mice per group, data represent mean ± SEM, one-way ANOVA). (D) Contingent survival and death of mice exposed to various temperatures (n = 20 mice per group). (E and F) H&E, UCP1, prohibitin, perilipin A, and endomucin staining of eWAT. Scale bars: 20 μm. (G) Quantification of AC size and UCP1-, prohibitin-, and endomucin-positive signals of eWAT (40 random fields from 8 mice in each group). *P < 0.05; **P < 0.01; ***P < 0.001, one-way ANOVA. Box-and-whisker plots show median (line within box), upper and lower quartile (bounds of box), and minimum and maximum values (bars).

