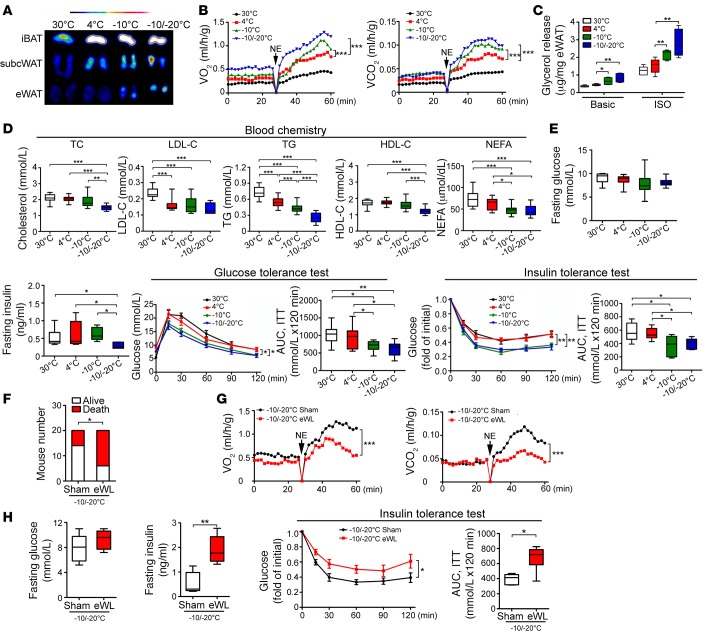
Figure 4. Micro-PET imaging, nonshivering thermogenesis, lipolysis, blood lipid profiling, and glucose metabolism.
(A) Micro-PET imaging of iBAT, s.c. WAT, and eWAT. (B) Metabolic rates of O2 consumption and CO2 production in response to norepinephrine (NE) (n = 5 mice per group, two-way ANOVA, data represent mean ± SEM). (C) Glycerol release from eWAT of various groups (n = 6 samples per group). One-way ANOVA. (D) Blood lipid profile of cholesterol, low-density lipoprotein cholesterol (LDL-C), triglycerides (TG), high-density lipoprotein cholesterol (HDL-C), and nonesterified fatty acids (NEFAs) (n = 15 samples per group). One-way ANOVA. (E) Fasting glucose, fasting insulin, insulin-tolerance test, and glucose-tolerance test with exposure to various temperatures (n = 8–10 animals per group). AUC of insulin-tolerance test and glucose-tolerance test. One-way ANOVA. (F) Contingency survival and death of eWAT-less (eWL) and sham-operated (Sham) mice exposed to –10°C/–20°C (n = 20 animals per group, χ2 test). (G) Metabolic rates of O2 consumption and CO2 production of eWL and sham-operated mice in response to norepinephrine (NE) under –10°C/–20°C (n = 5 animals per group). Two-way ANOVA, data represent mean ± SEM. (H) Fasting glucose, fasting insulin, and insulin-tolerance test of eWL and sham-operated mice exposed to –10°C/–20°C (n = 6 animals per group). AUC of insulin-tolerance test. *P < 0.05; **P < 0.01; ***P < 0.001, 2-tailed t test for fasting glucose, fasting insulin, and AUC; two-way ANOVA for insulin-tolerance test. Data represent mean ± SEM. Box-and-whisker plots show median (line within box), upper and lower quartile (bounds of box), and minimum and maximum values (bars).

