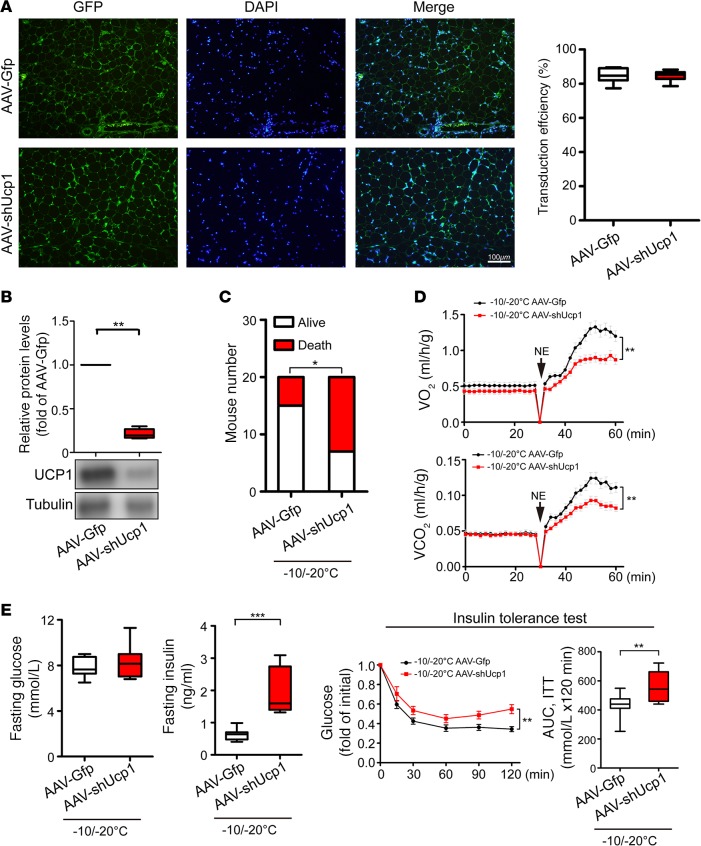
Figure 5. Impacts of UCP1 knockdown on global metabolic functions under an extreme cold condition.
(A) Immunohistological analysis of AAV transduction efficiency. AAV-Gfp– and AAV-shUcp1–transduced eWAT expressed GFP (green). The sections were counter-stained with DAPI (blue). Transduction efficiencies were quantified (n = 4 samples per group, 2-tailed t test). (B) Knockdown efficiency of endogenous UCP1 protein was analyzed by Western blot analysis (n = 6 samples per group, 2-tailed t test). (C) Contingent survival and death of AAV-Gfp– and AAV-shUcp1–transduced mice under –10°C/–20°C (n = 20 mice per group, χ2 test). (D) Metabolic rates of O2 consumption and CO2 production of AAV-Gfp– and AAV-shUcp1–transduced mice in response to norepinephrine (NE) under –10°C/–20°C (n = 5 mice per group). Two-way ANOVA, data represent mean ± SEM. (E) Fasting glucose, fasting insulin, and insulin-tolerance test of AAV-Gfp– and AAV-shUcp1–transduced mice under –10°C/–20°C (n = 10 mice per group). AUC of insulin-tolerance test. *P < 0.05; **P < 0.01; ***P < 0.001. 2-tailed t test for fasting glucose, fasting insulin, and AUC; two-way ANOVA for insulin-tolerance test. Data represent mean ± SEM. Box-and-whisker plots show median (line within box), upper and lower quartile (bounds of box), and minimum and maximum values (bars).

