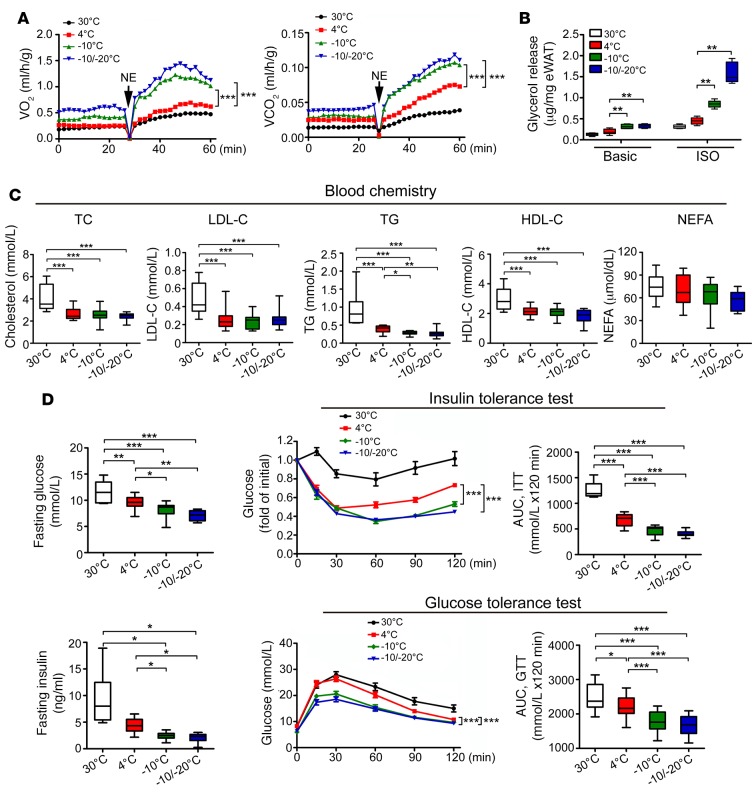
Figure 6. Nonshivering thermogenesis, lipolysis, blood lipid profiling, and glucose metabolism in HFD-fed obese mice.
(A) Metabolic rates of O2 consumption and CO2 production of HFD-induced obese mice in response to NE (n = 5 mice per group). Two-way ANOVA. Data represent mean ± SEM. (B) Glycerol release from eWAT of various HFD-induced obese mice (n = 6 samples per group). One-way ANOVA. (C) Blood lipid profile of cholestero (TC), LDL-C, TG, HDL-C, and NEFAs of HFD-induced obese animals (n = 15 samples per group). One-way ANOVA. (D) Fasting glucose, fasting insulin, insulin-tolerance test, and glucose-tolerance test of HFD-induced obese mice exposed to various temperatures (n = 8 samples per group for 30°C; n = 11–15 samples per group for other groups). AUC of insulin-tolerance test and glucose-tolerance test. *P < 0.05; **P < 0.01; ***P < 0.001. One-way ANOVA for fasting glucose, fasting insulin, and AUC; two-way ANOVA for insulin-tolerance test and glucose-tolerance test. Data represent mean ± SEM. Box-and-whisker plots show median (line within box), upper and lower quartile (bounds of box), and minimum and maximum values (bars).

