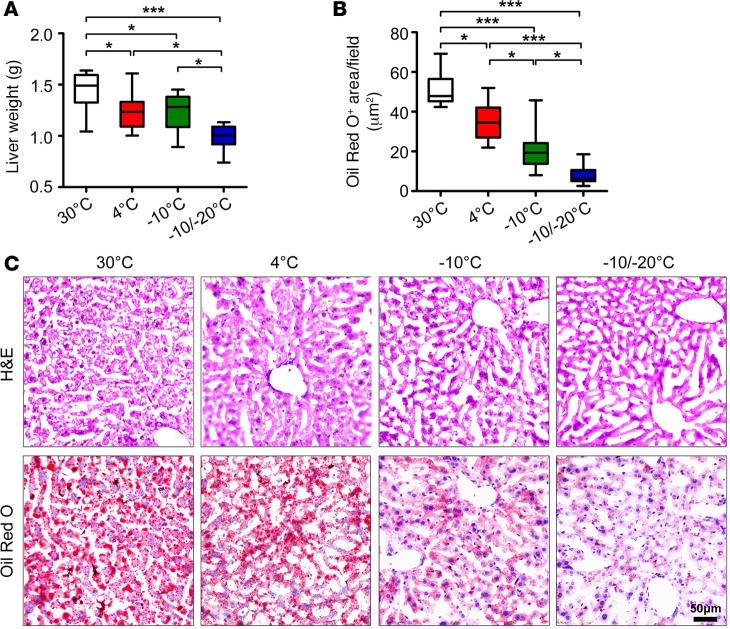
Figure 7. Liver steatosis in HFD-fed obese mice.
(A–C) Weight, H&E staining, and Oil Red O staining of liver tissues from HFD-induced obese mice exposed to various temperatures (n = 8 animals per group). Scale bar: 50 μm. Oil Red O–positive signals were quantified from 20 random fields. *P < 0.05; ***P < 0.001. One-way ANOVA.

