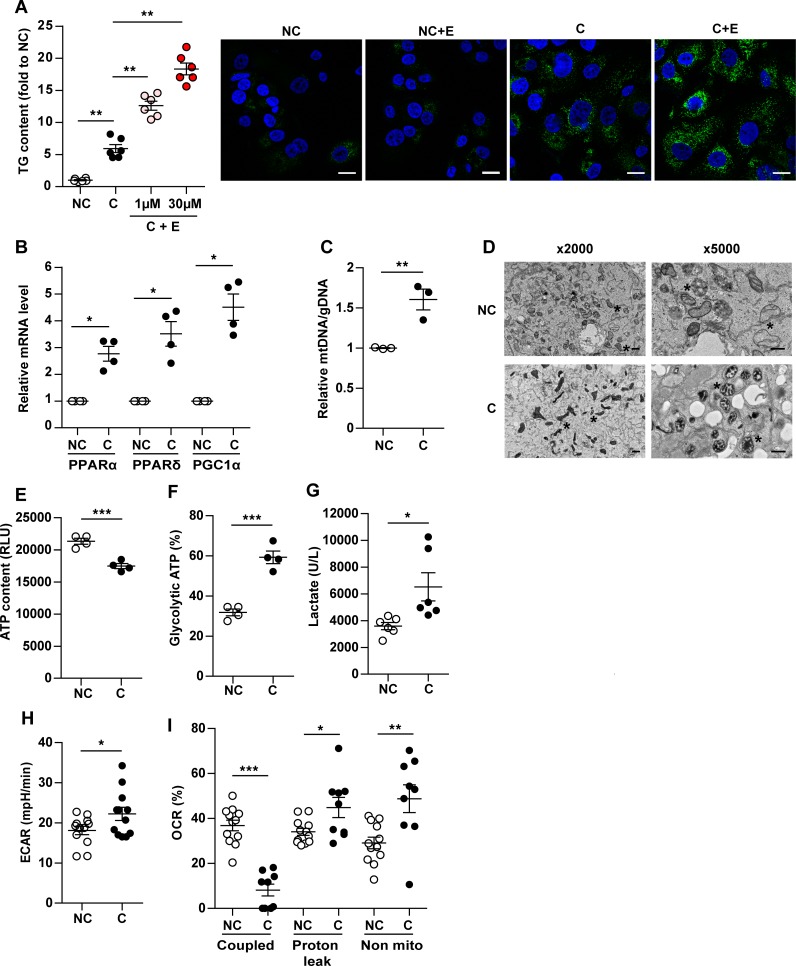
Figure 2. In the presence of adipocytes, breast cancer cells undergo a metabolic switch toward uncoupled mitochondrial fatty acid oxidation (FAO).
ZR-75-1 cells were cocultivated (C) or not (NC) with adipocytes for 3 days. (A) Lipid accumulation in tumor cells in the presence (+E) or not of Etomoxir (1 μM and 30 μM). Left, triglycerides (TG) content (n = 6). Right, lipid staining with Bodipy in green and DAPI in blue. Etomoxir (30 μM). Scale bars: 30μm. (B) Expression of the indicated genes measured by qPCR in tumor cells (n = 4). (C) Mitochondrial DNA (ratio of mitochondrial [mtDNA] to genomic [gDNA] DNA levels) levels in tumor cells (n = 3). (D) Representative experiments of transmission electron microscopy highlighting mitochondrial ultra-structural changes (*) in C or NC. Scale bars: 1 μm and 2 μm. (A and D) At least 3 experiments were conducted, and representative images are shown. (E) Total ATP production in tumor cells (n = 4). (F) ATP generated by glycolysis in tumor cells (n = 4). (G) Lactate released by tumor cells (n = 6). (H) Extracellular acidification rate (ECAR) evaluated after addition of 10 mM glucose to tumor cells (n = 12). (I) Oxygen consumption rate (OCR) was measured in the presence of palmitate and coupled respiration, proton leak and nonmitochondrial respiration were calculated as described in Methods (n = 9–12). Bars and error flags represent means ± SEM; statistically significant by Mann-Whitney U test (A, B and I) or Student’s t test (C–H), *P < 0.05, **P < 0.01, ***P < 0.001.

