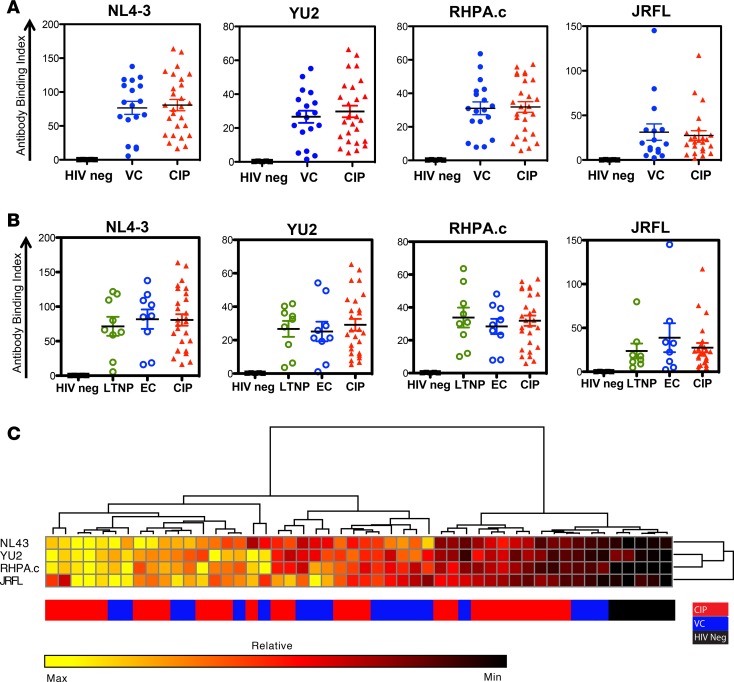
Figure 2. HIV-specific patient IgG binding to cell-associated and virus-incorporated (CANVI) epitopes.
(A) Panel of graphs show the binding index values for viral controller (VC) and chronically infected patient (CIP) IgG using 2 HIV molecular clone envelopes (Envs) (pNL4-3 [X4] or YU2 [R5]), transmitted founder (T/F) Env (RHPA.c), or primary R5 Env (JRFL). (B) The binding index values for CIPs vs. VC split into ECs vs. LTNPs. (C) Hierarchical clustering analysis of the relative percentile rank of Ab binding to each HIV-1 Env. Each column in the heat map indicates an individual patient’s IgG. Colored bars along the bottom correspond to the IgG patient group. The mean of 3 experiments for n = 50 IgG is shown.

