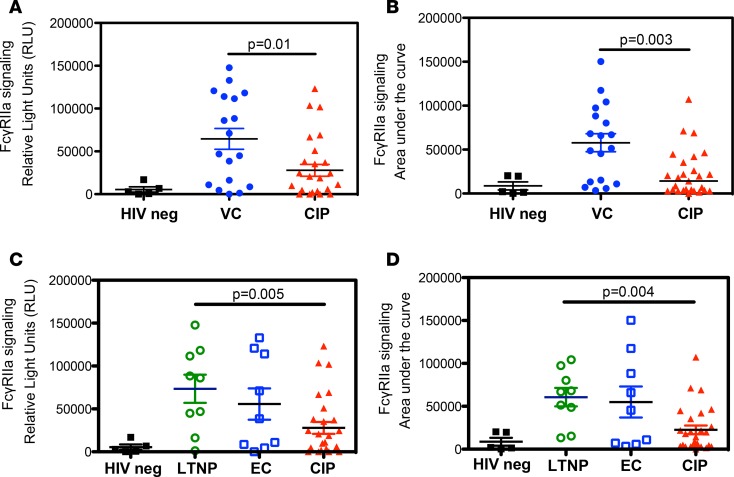
Figure 3. FCGR2A signaling in response to HIV+ patient IgG Abs.
Graphs depict the levels of FCGR2A signaling mediated by HIV+ patient IgG opsonized HIV-1 Δvpu–infected target cells. For FCGR signaling experiments, Abs were diluted 10-fold, starting at a top concentration of 250 μg/ml in a 5-point titration curve. (A and C) Maximum signals achieved at the top concentration of Abs tested (250 μg/ml). (B and D) The area under the signaling curve. (A and B) Comparison of VC vs. CIP. (C and D) Comparison of LTNPs, ECs, and CIPs. The mean of 3 experiments for n = 50 IgG is shown.

