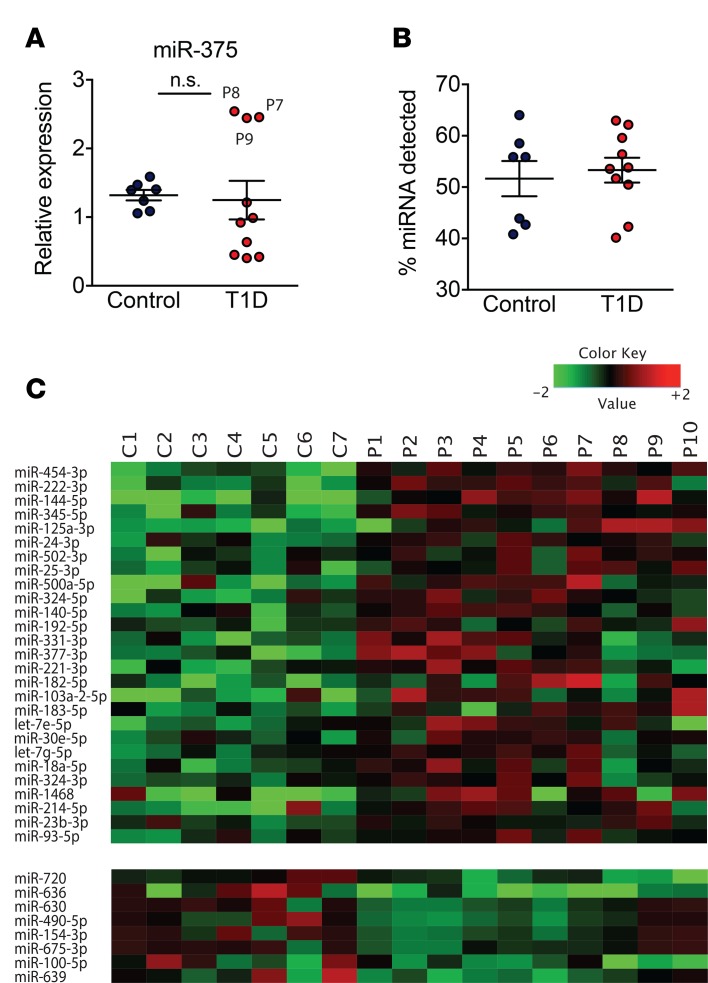
Figure 1. Candidate miRNA biomarkers of type 1 diabetes.
(A) miR-375 levels from the sera of 7 control and 10 children with recent onset of type 1 diabetes (T1D) were measured using qRT-PCR. (B and C) miRNA levels from the sera of 7 control and 10 children with recent onset of T1D were quantified using a locked nucleic acid–enhanced (LNA-enhanced) qPCR profiling platform. (B) Percentage of total miRNAs with Ct values <38 in each sample. (C) Heatmap showing significantly different expression levels of miRNAs among control (C1–C7) and T1D patients (P1–P10). P ≤ 0.05 by Student’s t test. (A and B) Data were analyzed by Student’s t test and are expressed as the mean ± SEM.

