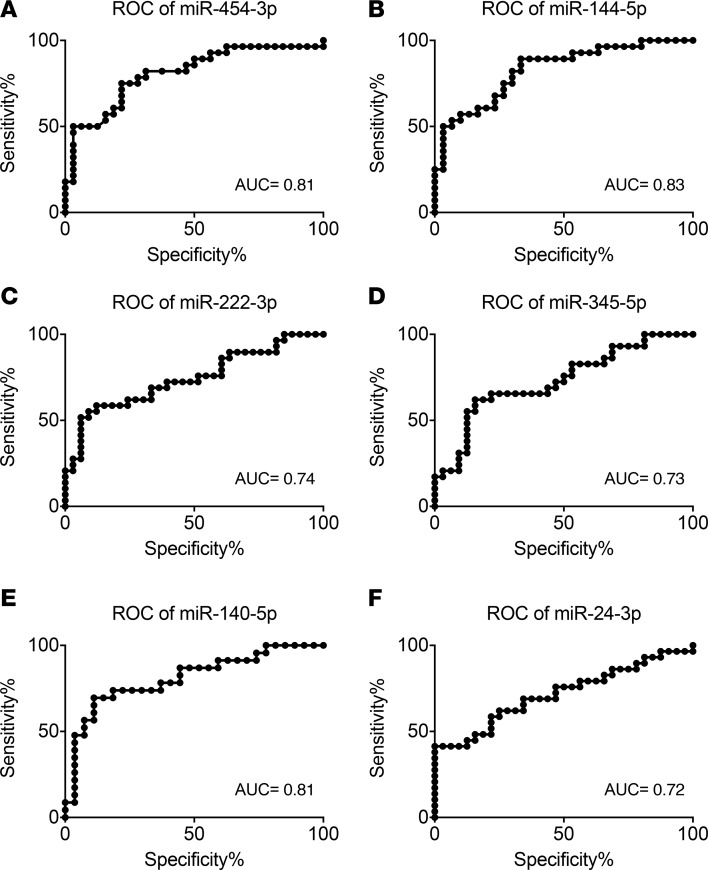
Figure 4. Receiver-operating characteristic curve analysis for detecting children with recent-onset type 1 diabetes.
True positive rate (sensitivity) is plotted as a function of the false positive rate (indicated in the figure as 100% specificity) for different miRNA levels. The AUC is a measure of how well a quantitative test can distinguish between subjects with and without a disease. Recent-onset type 1 diabetes (n = 29); controls (n = 32). ROC, receiver-operating characteristic.

