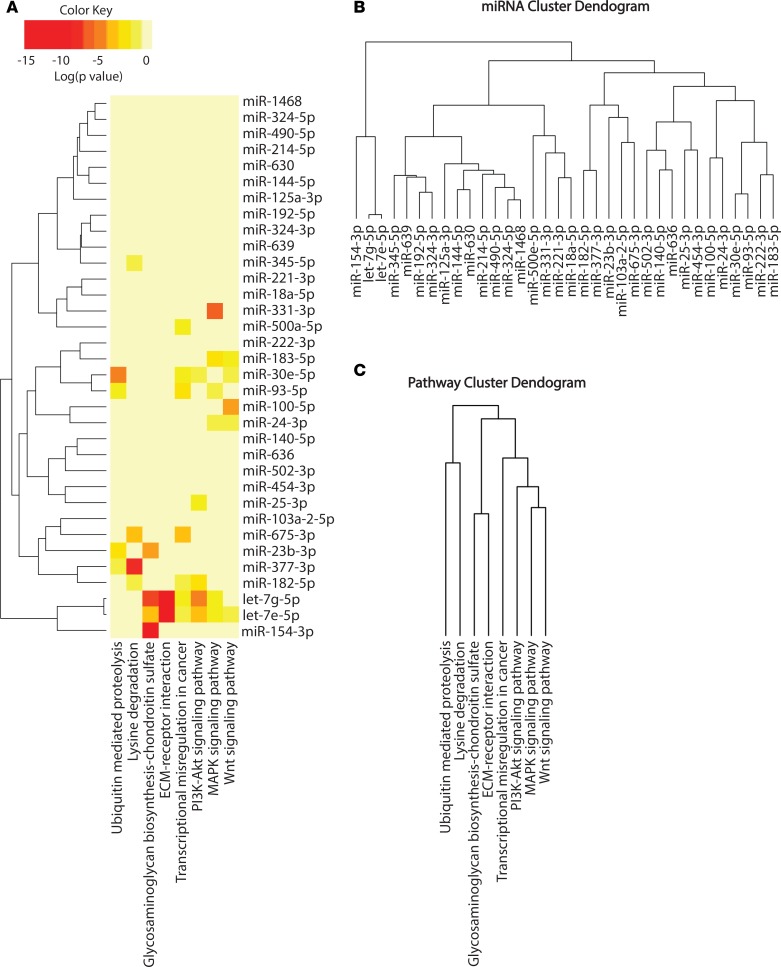
Figure 6. miRNA pathway analysis.
(A) Clustering is based on significance levels. Darker colors represent higher significance. On the miRNA axis, miRNAs displaying similar pathway targeting patterns are clustered together. (B) Hierarchical clustering of miRNAs based on the significance level of interaction. (C) Pathways are clustered based on the subset of miRNAs that target each pathway.

