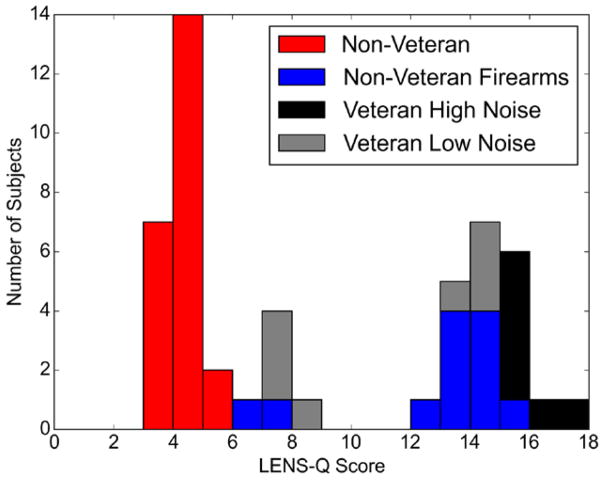
Fig. 1.
Distribution of LENS-Q scores. Distribution of the LENS-Q scores shown as a stacked barplot for 50 of the 64 study participants. The distribution is broken down by noise exposure group (final group assignments were used—see “Results” section). The remaining 14 participants were categorized into a noise exposure group based on the noise exposure interview alone. Each integer increase in LENS-Q score indicates a 10-fold increase in lifetime noise exposure. Note that the bars in this plot are stacked (e.g., 3 participants from the Veteran Low Noise group had LENS-Q scores of 7 to 8). LENS-Q indicates Lifetime Exposure of Noise and Solvents Questionnaire.

