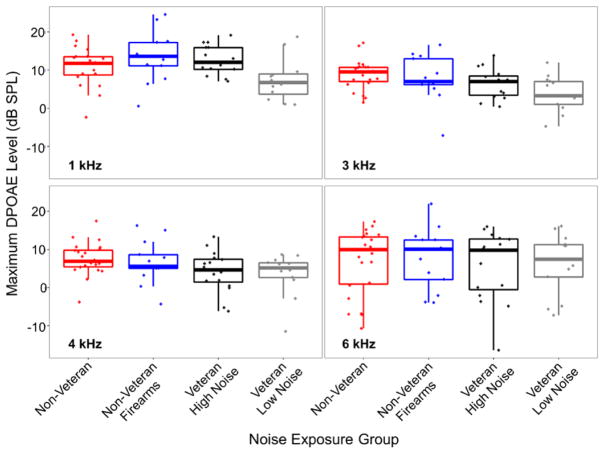
Fig. 3.
Maximum DPOAE levels across noise exposure group and frequency. DPOAE levels were similar across noise exposure groups. Maximum DPOAE levels were obtained from I/O functions at 1, 3, 4, and 6 kHz. In these boxplots, the line in the middle of the box represents the median value, the bottom and top of the box represent the 1st and 3rd quartile, respectively, and the end of the whiskers indicate the points furthest from the box that still fall within 1.5 interquartile ranges from the edge of the box. The dots indicate the maximum DPOAE level for each participant. DPOAE indicates distortion product otoacoustic emission; I/O, input/output.

