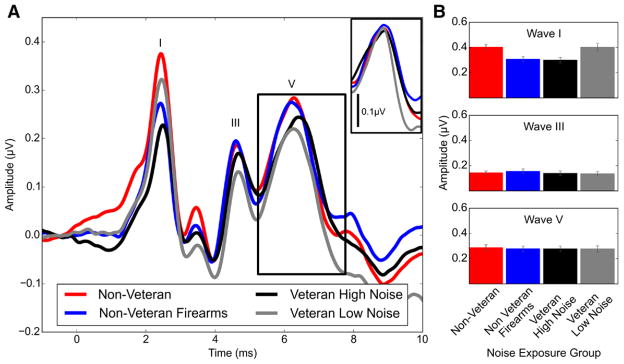
Fig. 4.
Mean ABR waveforms and peak amplitudes by noise exposure group. ABR wave I amplitude was reduced in the Veteran High Noise and non Veteran Firearms groups compared with the non Veteran control and Veteran Low Noise groups, while waves III and V were similar across groups. A, Waveforms were generated in response to a 110 dB p-pe SPL 4 kHz toneburst and averaged across all participants in each group. The peaks of waves I, III, and V are labeled. The inset shows the average wave V peak after correcting for variability in peak latency across participants. B, Wave amplitudes were measured from responses to a 110 dB p-pe SPL 4 kHz toneburst and then averaged across groups. Wave I and III amplitudes were measured as the difference in voltage between the wave peak and the following trough. Due to difficulty identifying the wave V trough in some participants, wave V amplitude was measured as the voltage difference between the wave V peak and the prestimulus baseline (average voltage measured for the 1-msec period of time before the stimulus presentation). Error bars indicate the standard error of the mean. ABR indicates auditory brainstem response.

