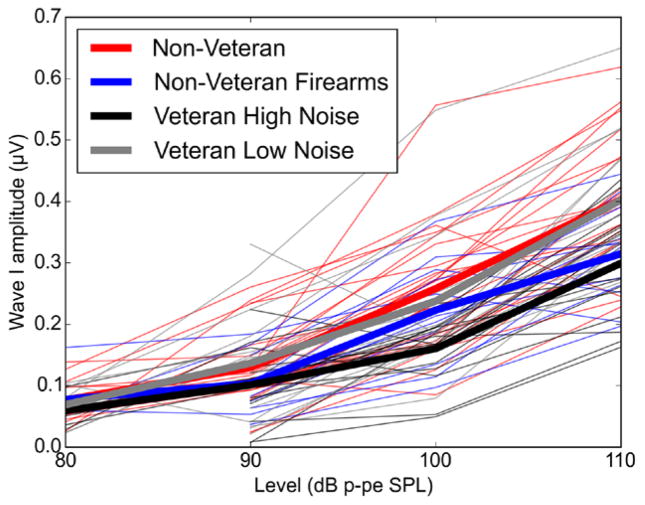
Fig. 5.
ABR input/output functions across noise exposure group. At higher stimulus levels, the Veteran High Noise and the non Veteran Firearms groups show reduced ABR wave I amplitude compared with the groups with less noise exposure history. I/O functions are shown for a 110 dB p-pe SPL 4 kHz stimulus. The thin lines represent wave I amplitudes for individual participants, color-coded by noise exposure group, while the thick lines show mean values for each group. For some participants, wave I could not be identified at 80 dB p-pe SPL, resulting in less data at that level. ABR indicates auditory brainstem response; I/O, input/output.

