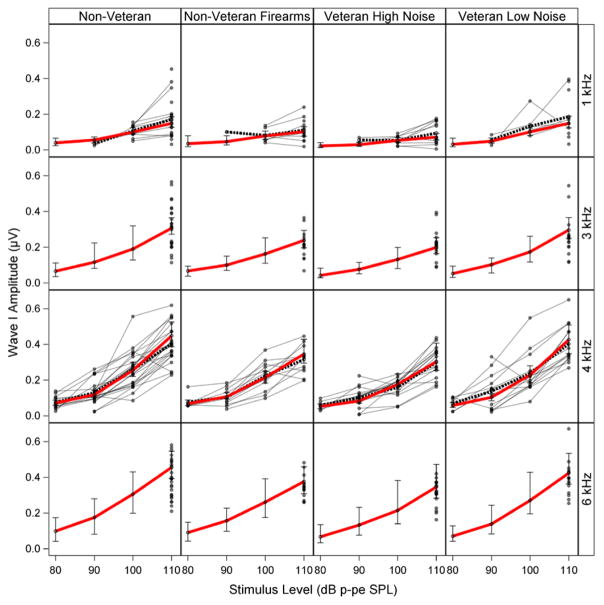
Fig. 6.
Fit of Bayesian regression model to study data. The fitted mean wave I amplitudes generated by the regression model show a good fit to the measured data across frequency and level. The fitted model is shown with a red line. The gray lines and circles indicate the measured wave I amplitudes for each participant. The black dashed line connects the sample mean wave I amplitudes at each level. The error bars are posterior 90% Bayesian confidence intervals of the fitted means. Although modeled mean wave I amplitudes are shown for all possible frequency/level combinations, no further inferences were made for frequency/level combinations where no ABR data were collected (e.g., 3 and 6 kHz for stimulus levels below 110 dB p-pe SPL). ABR indicates auditory brainstem response.

