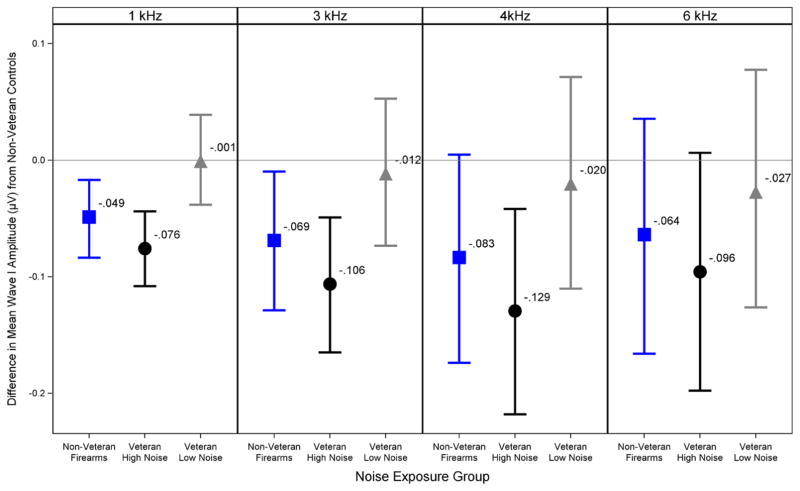
Fig. 7.
Modeled differences in group mean ABR wave I amplitudes. The Veteran High Noise and non Veteran Firearms groups show a reduction in predicted mean ABR wave I amplitude across frequency compared with the non Veteran control group. This plot shows group mean differences in ABR wave I amplitude after adjusting for sex and DPOAE levels by Bayesian regression. The difference in mean wave I amplitude for each noise exposure group compared with the non Veteran controls (in μV) is shown for a 110 dB p-pe SPL stimulus at each of the four tested frequencies. Values below the 0 line indicate a decrease in wave I amplitude compared with the non Veterans, while values above the line indicate an increase. Error bars show posterior 90% Bayesian confidence intervals. ABR indicates auditory brainstem response; DPOAE, distortion product otoacoustic emission.

