Fig. 8.
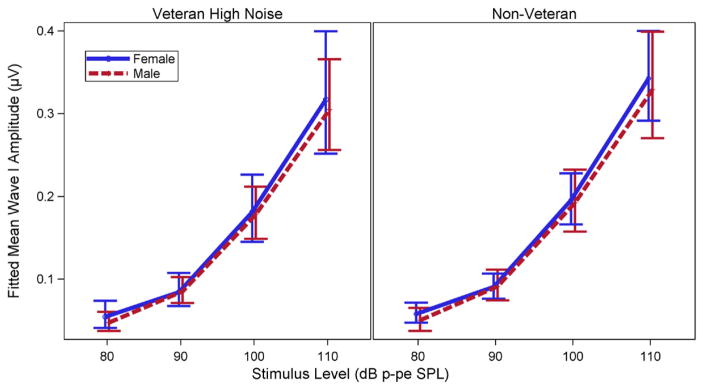
Modeled mean ABR wave I amplitude I/O functions by sex. Fitted mean ABR wave I amplitude I/O functions for the Veteran High Noise and non Veteran control groups show only weak effects of sex. I/O functions predicted by the Bayesian regression model are plotted for a 4 kHz toneburst stimulus and a DPOAE maximum level at 4 kHz of 5 dB SPL. Females are indicated by the solid blue line and males by the dashed red line. Error bars indicate posterior 90% Bayesian confidence intervals. Imbalances in the number of males vs. females for each group are reflected in the width of the confidence intervals. Plotted lines for males and females are slightly shifted horizontally to prevent overlap in the plot. Actual differences in mean wave I amplitudes are very small 0.013 μV (CI = −0.047 to 0.072) greater in females than males in the Veteran High Noise group at 110 dB p-pe SPL and 0.018 μV (CI = −0.071–0.095) greater in females in the non Veteran group). ABR indicates auditory brainstem response; CI, confidence interval; DPOAE, distortion product otoacoustic emission; I/O, input/output.

