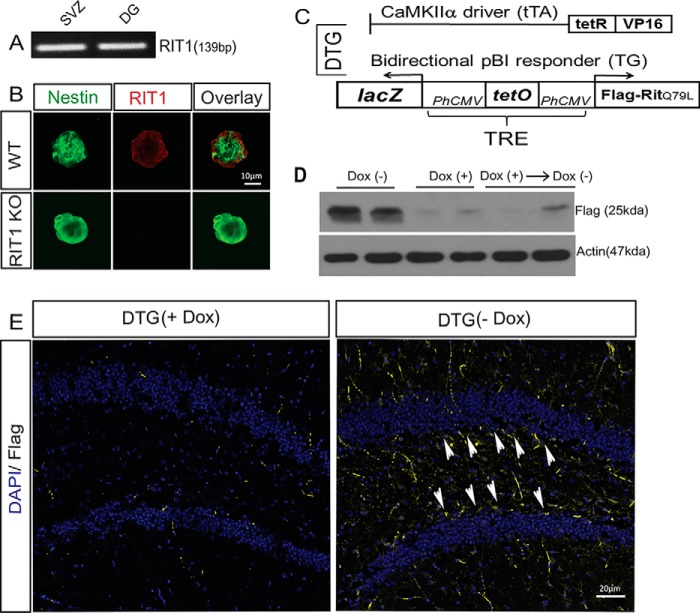
FIGURE 1.
Generation of the conditional RIT1 mouse model. A, semiquantitative RT-PCR demonstrates RIT1 expression in the adult mouse subventricular zone (SVZ) and DG (n = 4). B, representative confocal images of RIT1 protein expression in WT and RIT1−/− cultured neurospheres. C, schematic representing the binary transgenic system regulated by Dox to inducibly overexpress RIT1. D, representative Western blotting analysis showing FLAG-RIT1Q79L protein expression in brain extracts from 4-month-old DTG mice ± Dox versus WT control. E, representative immunohistochemistry for FLAG-RIT1Q79L (yellow) in the dentate gyrus of 4-month-old DTG mice on Dox (+) or 3 weeks after removal of the Dox diet (−). Arrowheads, FLAG-expressing cells. Nuclei (DAPI) are shown in blue (magnification ×20).

