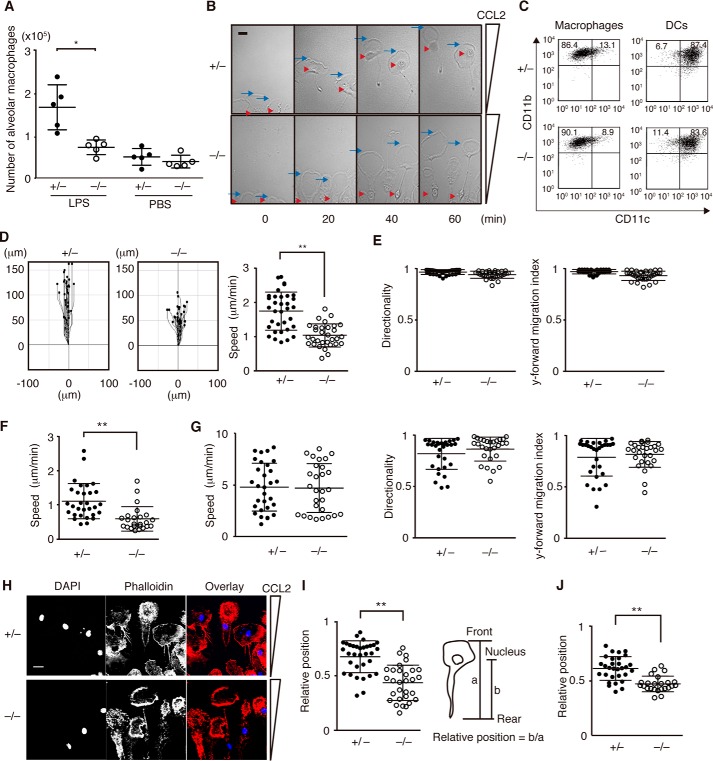
FIGURE 1.
DOCK8 regulates macrophage migration in 2D environments. A, comparison of alveolar macrophage accumulation between Dock8+/− and Dock8−/− mice. The central lines and error bars on the scatterplots represent the mean and S.D., respectively. Data are collected from 5 mice/group. *, p < 0.05 (two-tailed Mann-Whitney test). B, phase-contrast images of Dock8+/− and Dock8−/− BM-derived macrophages migrating along the CCL2 gradient. The blue arrow and red arrowhead indicate the leading edge and the nucleus, respectively. Scale bar = 10 μm. Data are representative of four independent experiments. C, BM-derived macrophages or DCs from Dock8+/− and Dock8−/− mice were analyzed for CD11c and CD11b expression. The numbers in the quadrants indicate the percentage of cells in each quadrant. Data are representative of three independent experiments. D and E, comparison of migration of Dock8+/− (n = 34) and Dock8−/− (n = 30) BM-derived macrophages in response to CCL2 stimulation on a 2D surface. The migration speed (D), directionality (E), and y-forward migration index (E) were calculated based on the movement of the leading edge. The central lines and error bars on the scatterplots represent the mean and S.D., respectively. **, p < 0.01 (two-tailed Student's t test). Data are representative of four independent experiments. F, comparison of migration of Dock8+/− (n = 30) and Dock8−/− (n = 24) peritoneal macrophages in response to CCL2 stimulation on a 2D surface. The migration speed was calculated based on the movement of the leading edge. The central lines and error bars on the scatterplots represent the mean and S.D., respectively. **, p < 0.01 (two-tailed Mann-Whitney test). Data are representative of three independent experiments. G, comparison of the migration of Dock8+/− (n = 30) and Dock8−/− (n = 28) BM-derived DCs in response to CCL21 stimulation on a 2D surface. The migration speed, directionality, and y-forward migration index were calculated based on the movement of the leading edge. The central lines and error bars on the scatterplots represent the mean and S.D., respectively. Data are representative of three independent experiments. H, immunofluorescent staining of chemotaxing Dock8+/− and Dock8−/− BM-derived macrophages with DAPI (1:5000) and phalloidin (1:500). Scale bar = 10 μm. Data are representative of three independent experiments. I, comparison of the relative position of the nucleus between Dock8+/− (n = 33) and Dock8−/− (n = 30) BM-derived macrophages 60 min after migration. The central lines and error bars on the scatterplots represent the mean and S.D., respectively. **, p < 0.01 (two-tailed Student's t test). Data are representative of four independent experiments. J, comparison of the relative position of the nucleus between Dock8+/− (n = 30) and Dock8−/− (n = 24) peritoneal macrophages 60 min after migration. The central lines and error bars on the scatterplots represent the mean and S.D., respectively. **, p < 0.01 (two-tailed Mann-Whitney test). Data are representative of three independent experiments.

