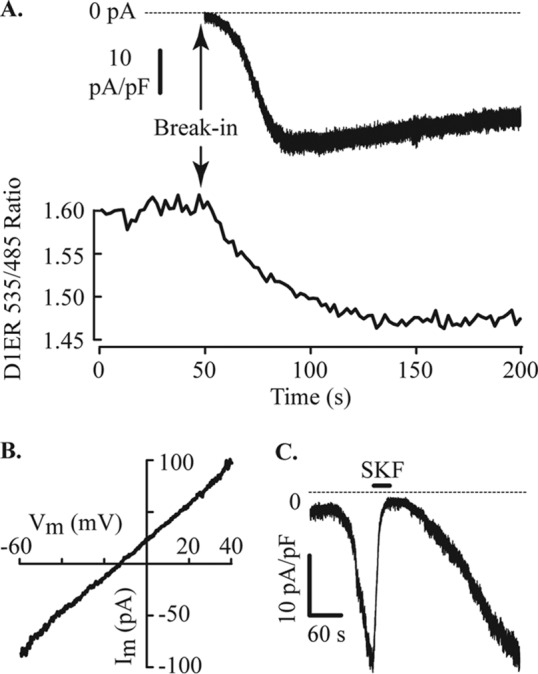
FIGURE 3.

Store depletion and activation of an inward current in MIN6 cells. A, membrane current and [Ca2+]ER were measured simultaneously in cells expressing D1ER, a FRET-based genetically encoded indicator of ER Ca2+. Whole cell recording of membrane current with normal bath solution and Cs+ pipette solution designed to passively deplete ER stores is shown. The FRET ratio decreased, proportional to [Ca2+]ER, immediately after break-in to the whole cell configuration. An inward membrane current started to develop within a few seconds and reached a peak after ∼1 min in this cell. The whole cell capacitance (Cm) of the cell illustrated was 4.2 pF. B, the current-voltage relation of the current after a voltage ramp from the holding potential of −60 mV to +40 mV at 1 V/s. This inward current has a linear current-voltage relation, and the mean reversal potential was −12.7 ± 2.3 mV (n = 27, −13.3 mV in the cell illustrated). C, extracellular application of the channel blocker SKF96365 (100 μm) reversibly inhibits the inward current. Break-in for this whole cell record occurred at the start of the trace. Shown is a representative example of six cells with a mean current inhibition of 92.3 ± 2.6% induced by SKF96365.
