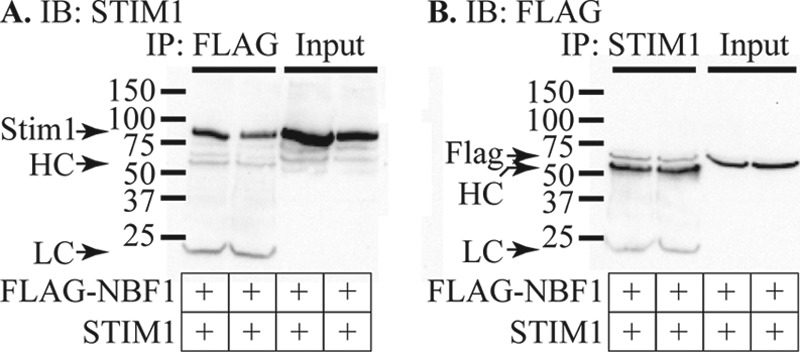
FIGURE 8.

STIM1 interacts with NBF-1 of SUR1. HEK293T cells were transfected with STIM1 and FLAG-NBF1 and IP performed using anti-FLAG (A) or anti-STIM1 (B). The data shown are representative of three independent IP experiments using four protein samples from different transfections. A, two protein samples from different transfections were collected and subject to IP using anti-FLAG followed by IB using anti-STIM1. The two left lanes show the results of IP, whereas the two right lanes show the corresponding input protein. The bands marked HC and LC that appear only in the IP lanes represent the heavy and light chains of the IP antibody. B, the same two protein samples as used in A were subjected to IP using anti-STIM1 followed by IB with anti-FLAG. IP lanes are shown on the left side of the panel, whereas the input protein is shown on the right. IP with anti-STIM1 pulled down FLAG-NBF1 and additional bands for the heavy and light chains of the IP antibody can be seen only in the IP lanes.
