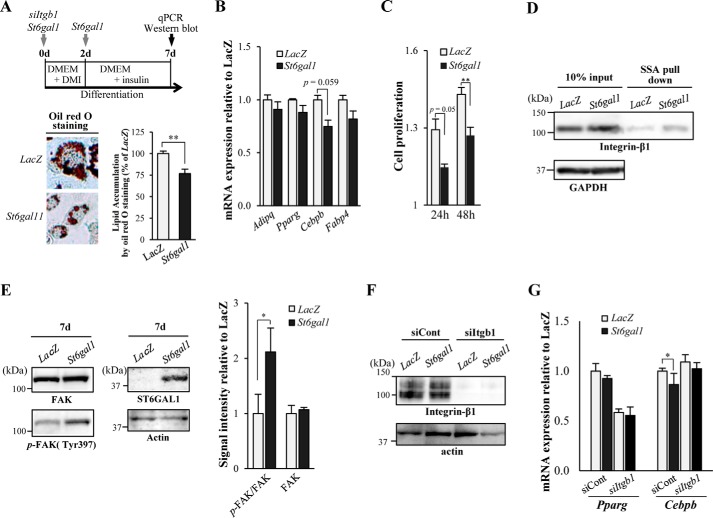
FIGURE 4.
Overexpression of St6gal1 inhibited adipogenesis and enhanced integrin-β1 activity. A, 3T3-L1 cells were infected with either an adenovirus vector encoding St6gal1 or a control vector (LacZ) before and during differentiation (days (d) 0 and 2), and were transfected with siRNA for Itgb1 before differentiation (day 0) (top panel). Microscopy images of oil red O staining of cells (bottom panel, left) were taken, and the amount of stained lipid in adipocytes was measured 7 days after differentiation (bottom panel, right). qPCR, quantitative PCR. B, on day 7, the levels of mRNA expression of adipogenesis-related genes were quantified (n = 3). C, 3T3-L1 cells (preadipocytes) were infected with St6gal1 or a control adenoviral vector (LacZ) on day 0. Cell proliferation was assessed at each time point after induction of differentiation (24 and 48 h) relative to the value of 0 h using the alamarBlue assay (n = 6). D, α2,6-sialylated proteins were pulled down with SSA lectin from 3T3-L1 lysates on day 7 and then subjected to SDS-PAGE and Western blot for integrin-β1. E, lysates of 3T3-L1 adipocytes on day 7 were blotted for FAK, phospho-FAK (p-FAK) and ST6GAL1 (left panel). The signal intensity of the bands in the Western blot was quantified and is shown as a graph (right panel). F, 3T3-L1 adipocytes were transfected with control siRNA or siRNA for Itgb1. Lysates of the cells on day 7 were blotted for integrin-β1 or actin. G, the levels of mRNA expression of adipogenesis-related genes were quantified on day 7 (n = 3). All graphs show mean ± S.E. (*, p < 0.05; **, p < 0.01; Student's t test).

