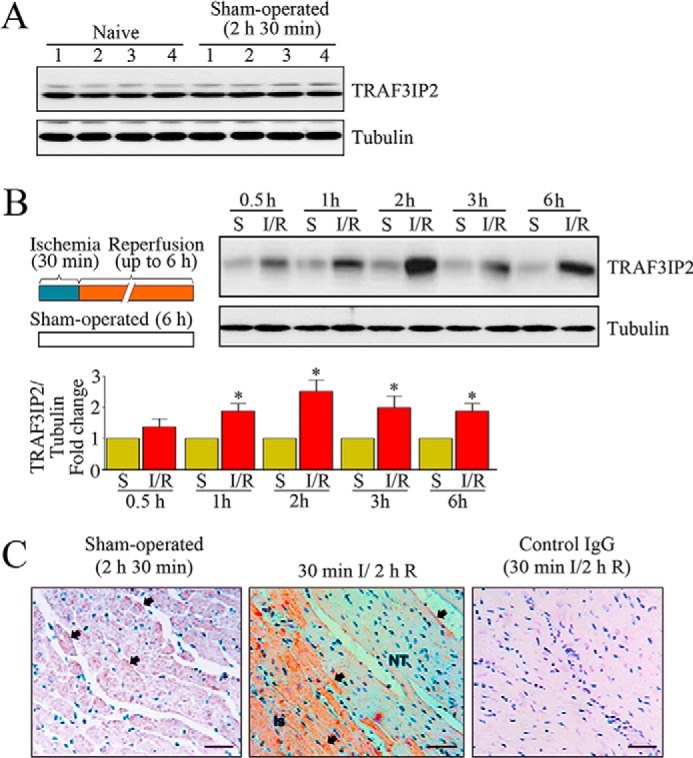
FIGURE 1.

Reperfusion (R) following 30 min of ischemia (I) induces TRAF3IP2 expression in the heart. A, sham operation fails to induce TRAF3IP2 expression. Control mice underwent sham operation. TRAF3IP2 expression was analyzed in LV tissue by immunoblotting. LV tissue from naive animals served as controls. Numbers at the top denote individual animals. B, I/R up-regulates TRAF3IP2 expression. Control mice underwent 30 min ischemia and reperfusion for up to 6 h. Details of the I/R protocol are shown on the left. TRAF3IP2 expression in the ischemic zones was analyzed by immunoblotting, and a representative immunoblot is shown. Sham-operated (S) and ischemia (I) alone groups served as controls. Intensity of immunoreactive bands from 5 to 6 animals was quantified by densitometry and summarized at the bottom. *, p < 0.01 versus Sham or Ischemia alone. C, localization of TRAF3IP2 in the heart following 30-min ischemia/2-h reperfusion. TRAF3IP2 expression was localized by immunohistochemistry (Is, ischemic zone; NT, normal tissue). Control IgG: normal mouse IgG2a. Arrows denote positive immunoreactivity.
