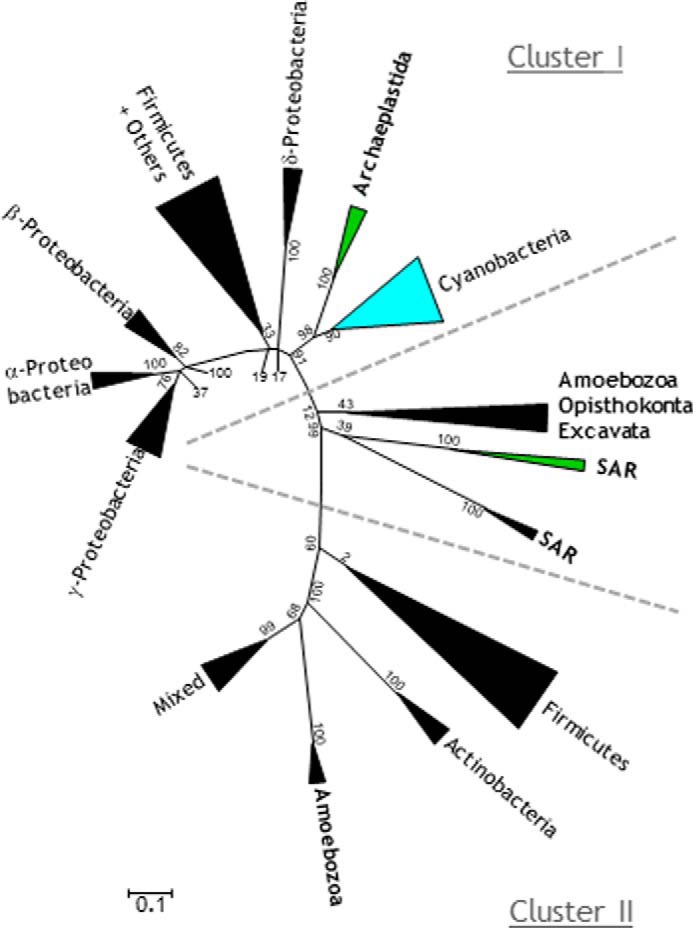
FIGURE 2.

Schematic phylogenetic tree of aldehyde/alcohol dehydrogenases from bacterial and eukaryotic sources. The tree was constructed using the maximum likelihood algorithm. Eukaryotic supergroups are indicated in bold type. Photosynthetic eukaryotes are indicated in green and cyanobacteria in blue. The list of species used in this analysis can be found in supplemental Data Set S1. Multiple sequence alignment is shown in supplemental Data Set S2.
