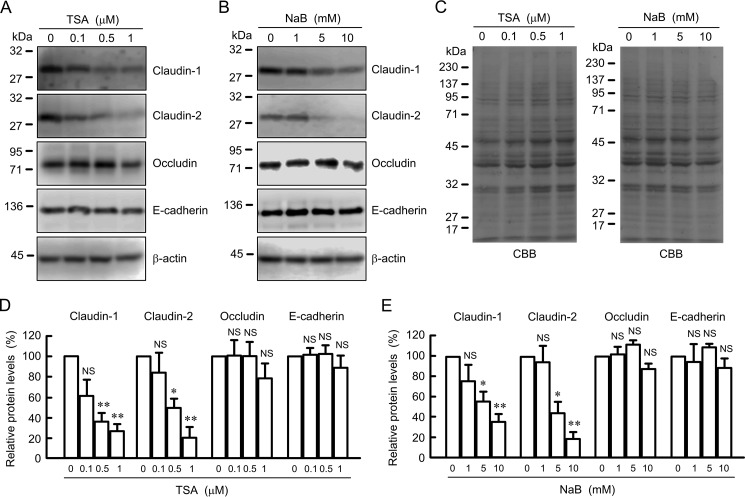
FIGURE 5.
Effects of TSA and NaB on the expression of junctional proteins. A and B, cells were treated with DMSO vehicle (0 μm), TSA, or NaB for 24 h at the indicated concentration. Cell lysates were immunoblotted with anti-claudin-1, anti-claudin-2, anti-occludin, anti-E-cadherin, and anti-β-actin antibodies. C, PVDF membrane was stained with CBB after immunoblotting. D and E, expression levels of claudin-1, claudin-2, occludin, and E-cadherin are represented as percentage of the values in 0 μm. n = 3–4. **, p < 0.01, and *, p < 0.05, compared with control or 0 μm. NS, p > 0.05.

