FIGURE 3.
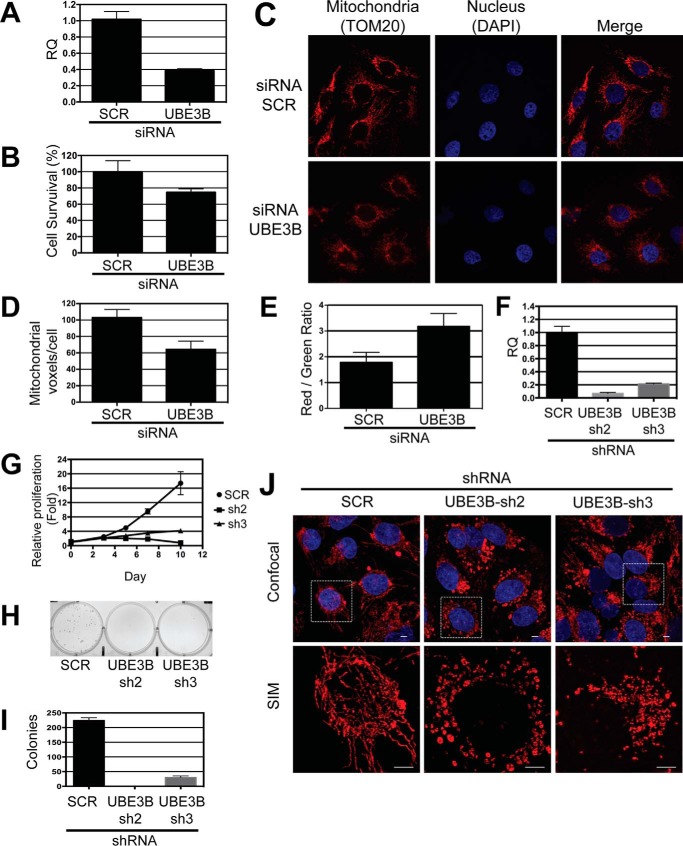
Knockdown of UBE3B compromises mitochondrial morphology and function and reduces cell proliferation and colony formation. LN428 cells were transfected with UBE3B siRNA or SCR siRNA (90 nm, final concentration) for 72 h before being used for subsequent experiments. A, qRT-PCR was performed to measure the siRNA-mediated knockdown of UBE3B mRNA expression. β-Actin was used as the endogenous control, and mRNA expression was normalized to SCR siRNA cells. RQ indicates the relative quantification. B, to determine cellular metabolic activity, as an indicator of decreased cellular survival, 2000 cells/well were plated 24 h after siRNA transfection. After 48 h of incubation, an MTS assay was performed. C, to determine whether there are changes in mitochondrial morphology after depletion of UBE3B protein, confocal imaging was performed on fixed cells 72 h after siRNA transfection. ATP synthase β is the mitochondrial marker detected by immunofluorescence (excitation wavelength, 647 nm; emission wavelength, 666 nm). D, Z-stacking using confocal microscopy on the fixed cells from C was performed to determine the changes in mitochondrial voxels in UBE3B-KD cells as compared with scrambled (negative control) treated cells. E, to determine whether UBE3B knockdown induced mitochondrial stress, cells were co-transfected with UBE3B siRNA, and the ratiometric reporter gene Mito-Timer. Confocal imaging was performed 72 h after transfection. Quantitation of the collected images reveal an increase in mitochondrial stress in the UBE3B knockdown cells. F, LN428 cells were individually transduced with lentivirus expressing a scrambled shRNA control or either of two lentiviral shRNAs (sh2 and sh3) targeting different sequences of UBE3B. 48 h later, the loss of UBE3B mRNA expression was measured by qRT-PCR and normalized to the SCR control. G, 48 h after lentiviral infection, the SCR, sh2, and sh3 cells were seeded at 5000 cells/well in 24-well plates in 500 μl/well growth medium. The cell numbers of each plate were counted at 2 h after seeding and then again on days 3, 5, 7, and 10. The relative proliferation for each cell line was calculated by normalizing the cell number each day to the cell number at 2 h after seeding. H, 48 h after lentiviral infection, the SCR, sh2, and sh3 cells were seeded at 500 cells/well in 6-well plates in 5 ml/well growth medium and incubated for 10 days. The colonies were stained with crystal violet, and images were generated. I, quantitation of the clonogenic assay from the results in H, using Celigo, showed a strong decrease of colony numbers in both shRNA knockdown cells. J, to validate changes in mitochondrial morphology, UBE3B-sh2 and UBE3B-sh3 cells were stained with MitoTracker CMX-ROS and fixed, and correlative microscopy was performed with confocal (top row) and SIM super-resolution microscopy (bottom row), showing changes induced by UBE3B knockdown.

