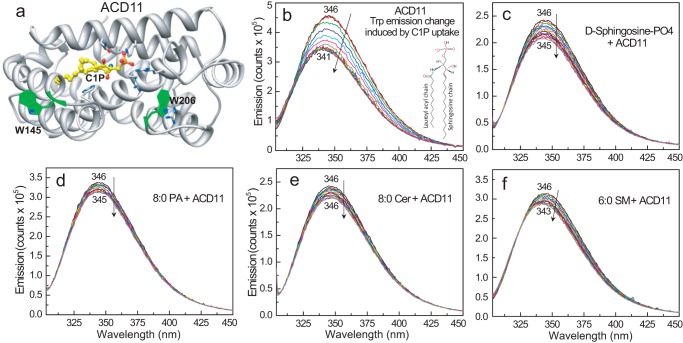
FIGURE 1.
C1P binding to ACD11 in solution. a, structure of ACD11 (13) showing the location of intrinsic Trp (W145 and W206) with respect to bound C1P (Protein Data Bank entry 4NTI). b, ACD11 Trp emission change induced by C1P uptake. N-Octanoyl-C1P was added stepwise (C1P step concentration = 0.08 μm in EtOH (1 μl)) to ACD11 (1 μm) stirring in buffer (sodium phosphate (pH 6.6) containing 150 mm NaCl) with 5-min incubation times between injections. The vertical arrow indicates response to increasing C1P concentration. Increments beyond the sixth addition (∼0.48 μm C1P) induce little change in Trp emission intensity or wavelength maximum (λmax blue shift), yielding a saturable binding response. c, same as b, but lipid titrant is sphingosine 1-phosphate; d, same as b, but lipid titrant is phosphatidic acid; e, same as b, but lipid titrant is ceramide; f, same as b, but lipid titrant is sphingomyelin.

