FIGURE 2.
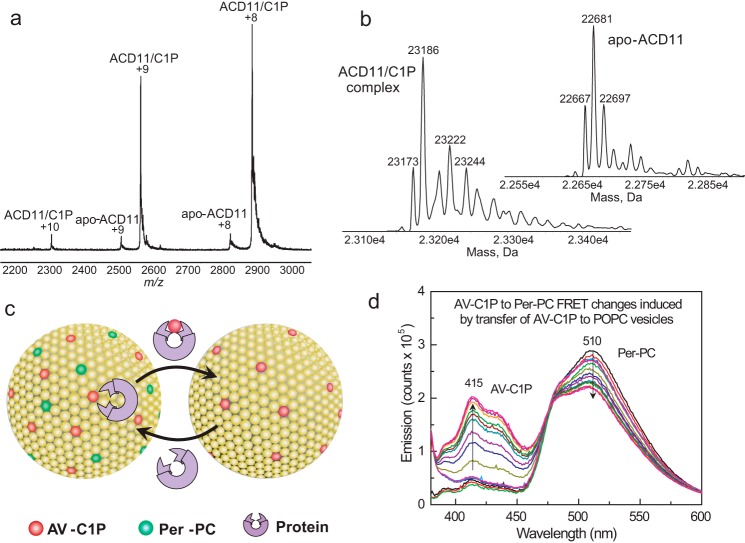
Surface electrostatics surrounding the sphingolipid liganding site in ACD11, CPTP, and GLTP and sphingolipid intermembrane transfer measurement using a FRET-based assay. a, ESI-MS analysis of ACD11·C1P complex. Direct infusion under nondenaturing conditions results in two main positive charge states (+8 and +9) for the ACD11·N-octanoyl C1P complex. Traces of apo-ACD11 also are evident for the +8 and +9 charge states. The m/z label (x axis) represents mass divided by charge number. b, the transformed spectra indicate molecular masses of 22,681 Da for apo-ACD11 and 23,186 Da for the ACD11·N-octanoyl C1P complex, confirming a single binding site for C1P. c, schematic for in vitro measurement of SL intermembrane transfer via FRET loss. In the SL source vesicle, the AV-SL fluorescence signal (energy donor; red dots) is low due to FRET involving perylenoyl-PC (energy acceptor; green dots; nontransferable lipid). Loss of FRET occurs when AV-SL is removed by protein (catalytic amount) and transferred to the excess (10-fold) POPC receiver vesicles, resulting in a time-dependent increase in AV-SL emission signal. d, spectral emission changes for AV-SL/Per-PC energy transfer pair showing FRET loss induced by transfer protein activity. AV-C1P and Per-PC are at 1 mol % in SL source vesicles. Black, red, and green traces, successive scans of SL source vesicles (2.5-min intervals) showing signal stability; blue, cyan, and magenta traces, successive scans (2.5-min intervals) after the addition of excess POPC receiver vesicles; other spectral traces show the time-dependent emission changes in AV and Per (2-min intervals) after injection of transfer protein (2 μg).

