Fig. 1.

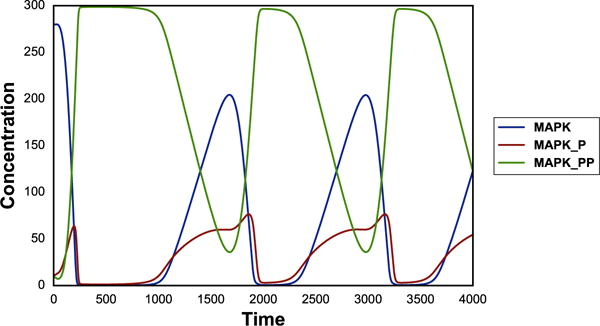
Output of a simple time course simulation. Blue line represents MAP kinase, red line represents phosphorylated MAP kinase, and green line represents double phosphorylated MAP kinase.

Output of a simple time course simulation. Blue line represents MAP kinase, red line represents phosphorylated MAP kinase, and green line represents double phosphorylated MAP kinase.