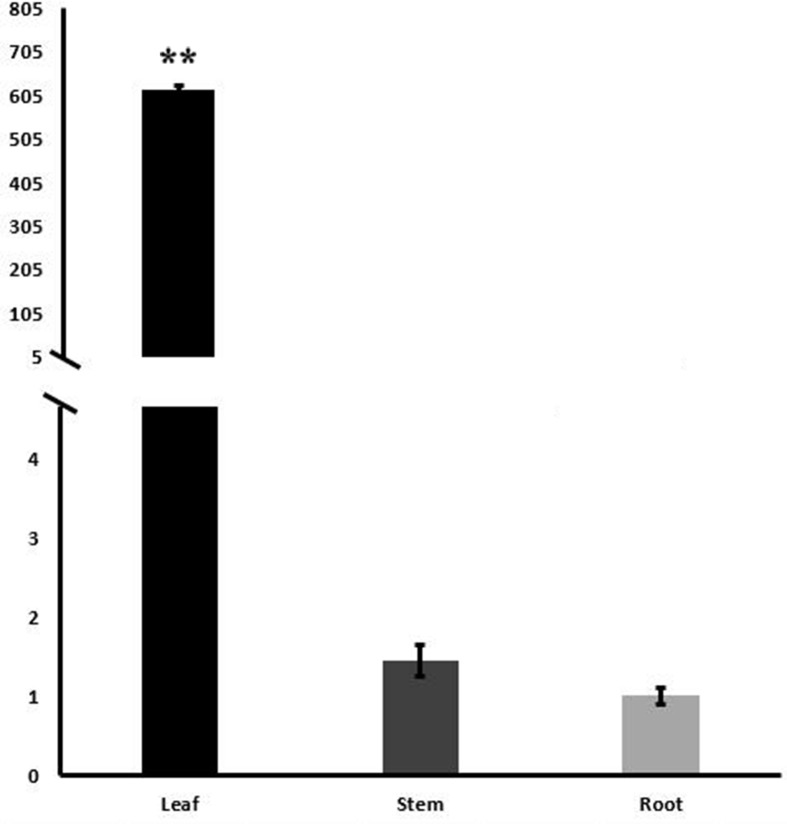
Fig 5. Tissue-specific transcript profiling of WRAB18 in root, stem and leave.
The root, stem and leave samples were collected from two-leaf-period wheat seedlings and qRT-PCR was performed. Data plotted are the mean values ± SD from three independent experiments (n = 3; biological replicates). Statistically significant differences were analyzed using the Student’s t-test (*p<0.05 or **p<0.01).

