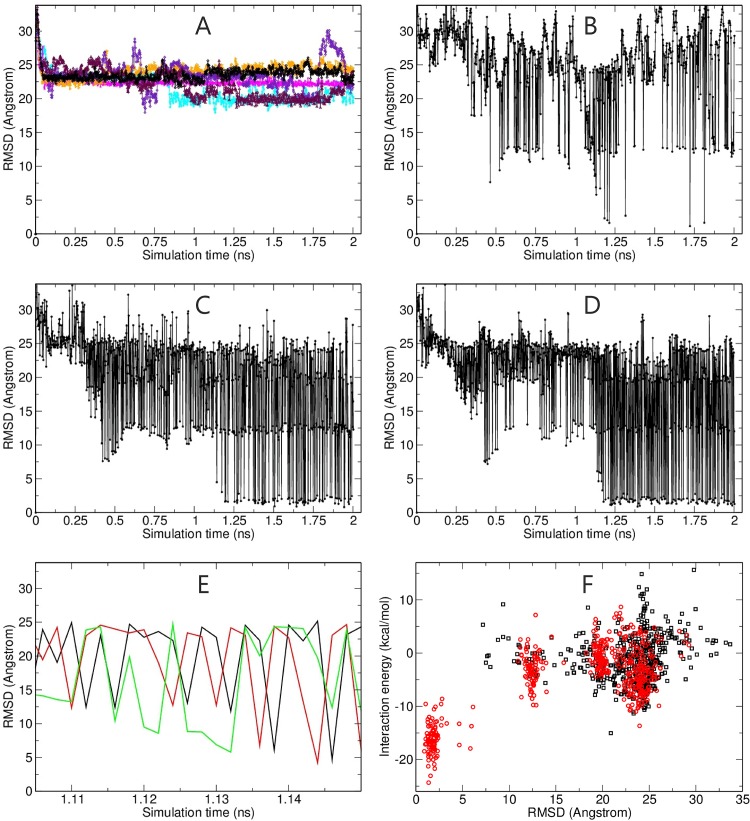
Fig 3.
(A) Root mean square deviation of the ligand (RMSDlig) helix (backbone atoms, after superposition of the receptor part onto the reference) from the native position in the homeodoman arrangement (pdb2sy9) during six MD simulations (each 2 ns, color coded lines) starting from the a placement on a side of the receptor opposite to the native binding position (see Fig 2). The RMSDlig in case of the RP-REMD-Dock simulations in replica 6, 3 and in the reference replica (1) is indicated in B-D, respectively. (E) Enlarged view of the sampled states in the time regime around 1.1–1.15 ns for the RMSDlig of replica 6 (green line), replica 3 (red line) and replica 1 (black line, reference replica) during the REMD simulation. (F) Calculated non-bonded interaction energy of the sampled complexes vs RMSDlig of the complexes sampled in the reference replica. The black squares indicate the sampling during the first half of the BP-REMD whereas the red circles are the states sampled in the second final stage of the BP-REMD. Note, that the interaction energy was calculated from a re-evaluation of the sampled trajectory using an infinite cutoff for the electrostatics and the GB-model.

