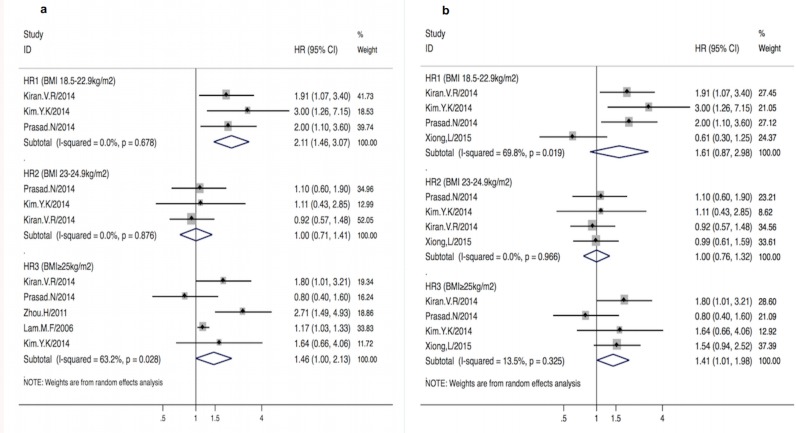
Fig 4.
a-b. Pooled HR1-3 with 95%CI of all-cause mortality in different BMI groups after excluding specific studies. Fig 4a Pooled HR1-3 with 95%CI of all-cause mortality in different BMI groups after excluding Xiong et al’s [29] study. Fig 4b Pooled HR1-3 with 95%CI of all-cause mortality in different BMI groups after excluding Lam et al’ s [27] and Zhou et al’ s [30] study. Solid diamond -HR from individual study; Shadowed square behind solid diamond- statistical weight that each study contributes to the random-effect summary estimate; Hollow diamond-the overall summary HR. Horizontal line-the study specific 95%CI. HR1-3-adjusted hazard risk for underweight, overweight and obese group vs. normal BMI group based on Asian BMI categorization.

