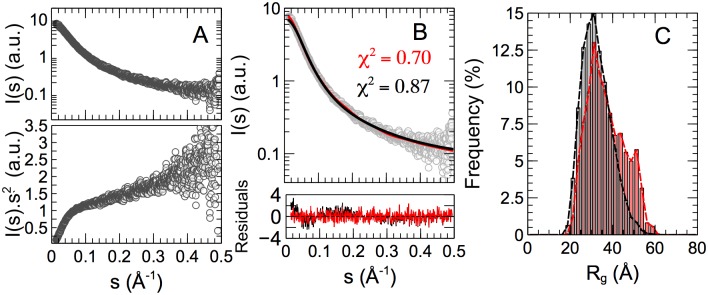
Fig 5. SAXS data and analysis on KISS1.
(A) Logarithmic (top) and Kratky (bottom) representations of SAXS intensity versus momentum transfer s (open circles). (B) Averaged back-calculated curves derived from a statistical random coil ensemble (black line) and EOM selected sub-ensemble (red line). The goodness-of-fit is indicated by χ2 values. The bottom panel shows the residuals of the fitting for both conformational ensembles. (C) Distribution of the radius of gyration, Rg, in the random coil ensemble (gray-bars) and EOM selected sub-ensemble, where a shoulder peak around 50 Å contains ca. 30% of all conformers.

