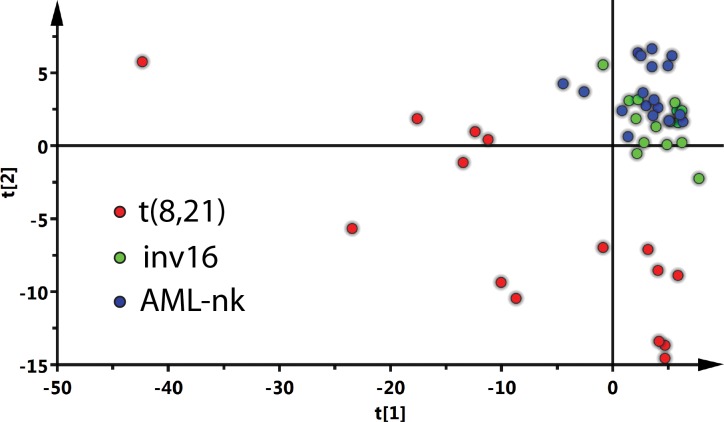
Fig 1. Score plots of multivariate analysis by PCA.
The t(8;21) samples are separated from the inv16 and AML-nk samples. Each patient sample was measured in triplicates and each point on the plot represents an individual measurement. The calculated sum of squares was 0.253 and 0.094 for the first and second component, respectively. The analysis was performed using SIMCA 14.0 software.

