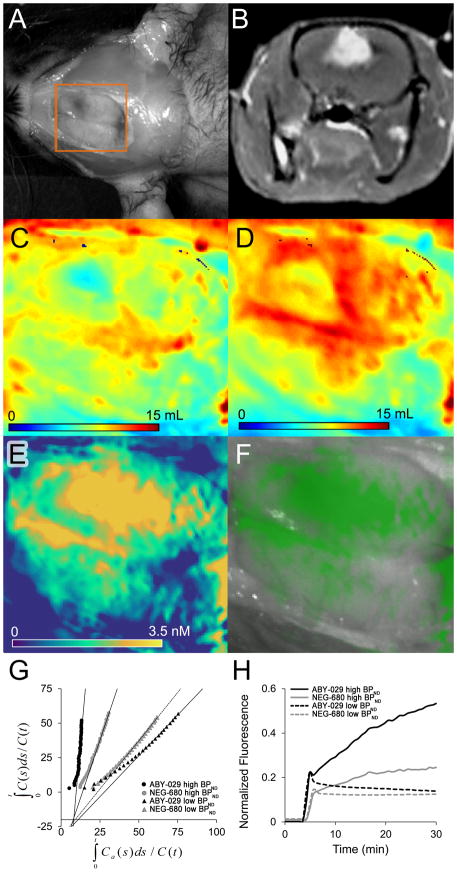
Figure 5.
(A) Open craniotomy of U251 human glioblastoma bearing rat and corresponding (B) Gadolinium-enhanced T2-weighted MRI image showing enhancing lesion in right hemisphere (C) NEG-680 distribution volume (mL), (D) ABY-029 distribution volume (mL) and (E) EGFR concentration map determined by AIGA. (F) Overlay of the [EGFR] map from E on the grayscale white-light image encoded by varying the transparency of a monochromatic green colormap according to a gamma function (A = 0.7, γ = 1.8) (G) The AIGA plots for high-binding (circles) and low-binding (triangles) region for NEG-680 (gray) and ABY-029 (black), (H) The tissue uptake curves for the high-binding (solid) and low-binding (dashed) regions for NEG-680 (gray) and ABY-029 (black). Spatial location of panels C–F are indicated by the orange box in panel A.

