
Figure 11.
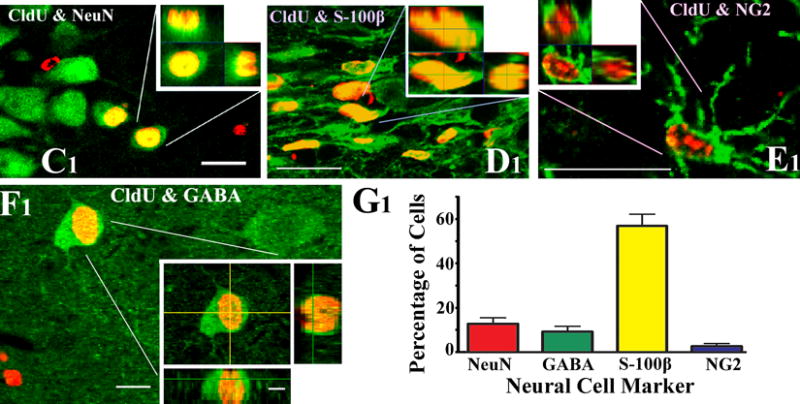
Examples of the differentiation of MGE-NSC graft-derived CldU+ cells into NeuN+ mature neurons (C1), S-100β+ mature astrocytes (D1), NG2+ oligodendrocyte precursors (E1) and GABA+ neurons (F1), visualized via dual immunolabeling for CldU (red) and markers of neurons/glia (green) and z-section analyses under a confocal microscope. Scale bar, C1–E1, 20 μm; F1, 10 μm; orthogonal inset of F1, 5 μm. The bar chart in G1 depicts the percentages of graft-derived cells that differentiate into NeuN+ neurons, GABA+ neurons, S-100β+ astrocytes and NG2+ oligodendrocyte precursors. Reproduced from Waldau et al. (2010).