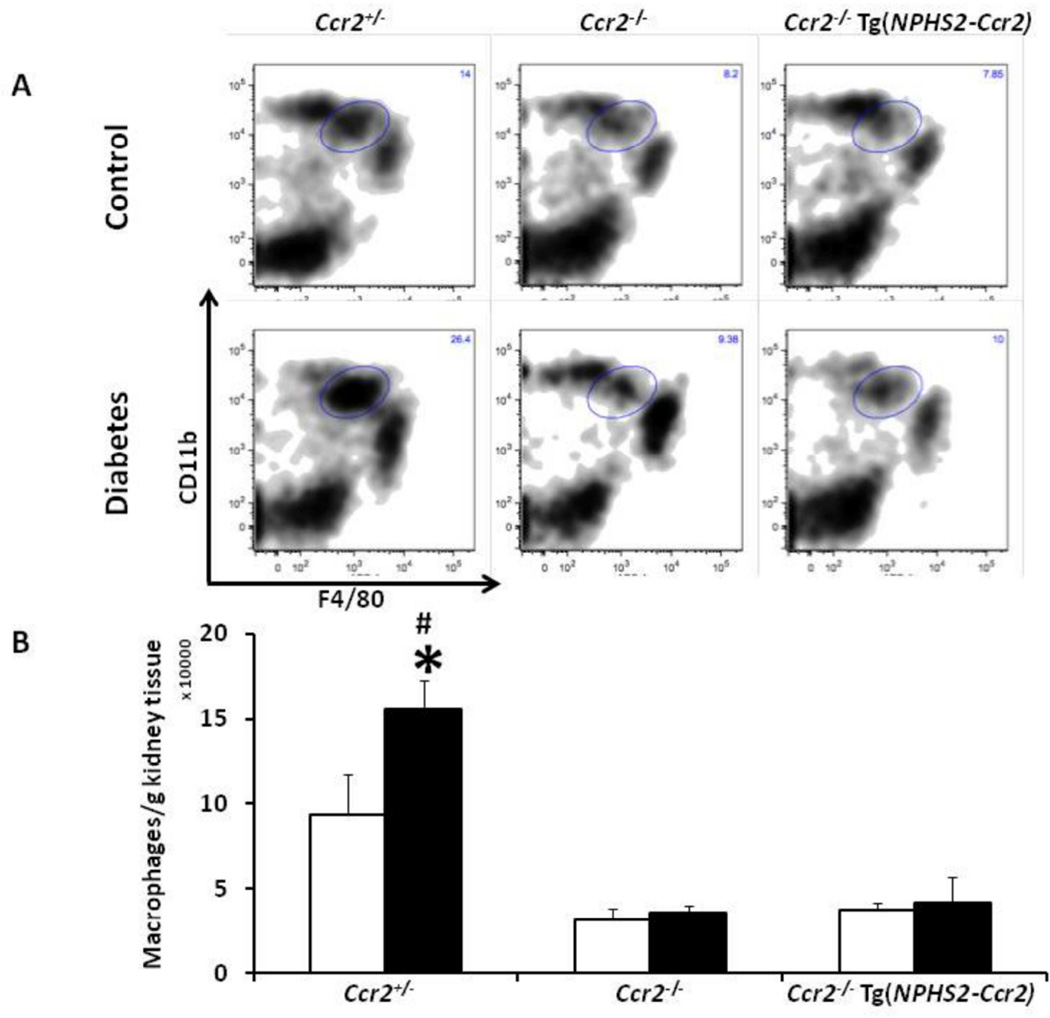
Figure 7. Effect of podocin2.5-CCR2 expression on total kidney macrophage infiltration in diabetic mice.
(A) Kidneys were harvested at 9 weeks following diabetes and processed for fluorescence-activated cell sorting (FACS) analysis as described in the method section. Macrophages were identified as CD11bhighF4/80low. Graphs show representative density contour plots. B) Summary data for macrophages/gram kidney tissues. Open bar, control groups; black-filled bar, diabetic groups. Results are means ± SEM. *p<0.05 compared to control. #p<0.001 compared to diabetic Ccr2−/− and diabetic Ccr2−/− Tg(NPHS2-Ccr2) mice.

