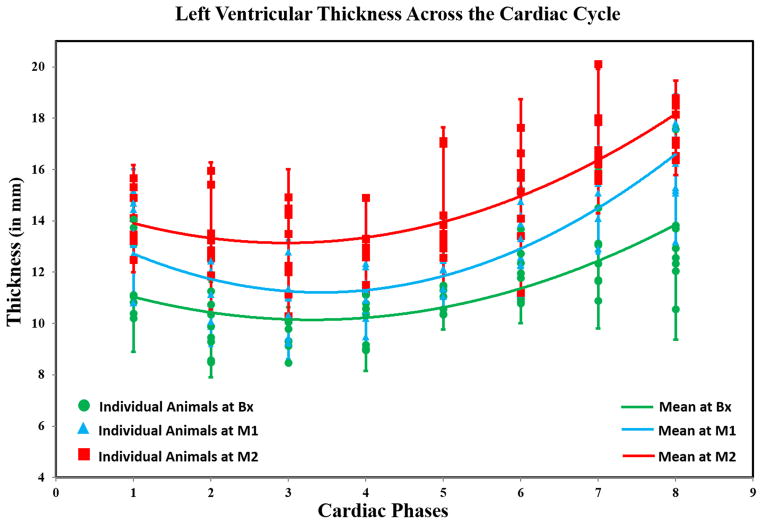
Figure 2. Mean LV Thickness as a Function of the Cardiac Cycle on a Mid-Ventricular Slice from all Animals.
Marker-shapes correspond to imaging time-points. The plot shows that mean LV-thickness increased progressively from Bx (green-curve; R2=0.94) to M1 (blue-curve; R2=0.92) to M2 (red-curve; R2=0.81) indicating that the animals developed LV hypertrophy over time.

